Abstract
Post laryngectomy voice rehabilitation is very challenging in centres with limited resources because of cost concerns and morbidity. A study of laryngectomised voice rehabilitated patients on follow up was performed to look into overall quality of life (QOL), morbidity and voice quality. Those patients who had visited head and neck surgical outpatient department during the period of January 2008 to October 2009 were evaluated for their QOL, morbidity and voice quality, objectively and subjectively. Voice rating and QOL rating showed a distinct discrepancy which could be explained by the morbidity recorded for surgical voice restoration in the present study. Voice rehabilitation strategy after laryngectomy in a low resource setting has to take in account financial social educational background of the patient besides technical issues.
Keywords: Post laryngectomy voice rehabilitation, Outcome, Speech, QOL, Morbidity
Introduction
Voice rehabilitation strategy after laryngectomy has to be distinct in a low resource setting due to cost and morbidity concerns. The present study aims at analyzing the patient reported outcomes, complications and objective and subjective evaluation of restored speech to formulate a post laryngectomy voice rehabilitation strategy applicable to a low resource, high volume Indian tertiary referral cancer centre.
We performed an overall quality of life (QOL), morbidity assessment and objective and perceptual analysis of outcome of voice restoration in laryngectomees who were on follow up at the outpatient department.
Methods
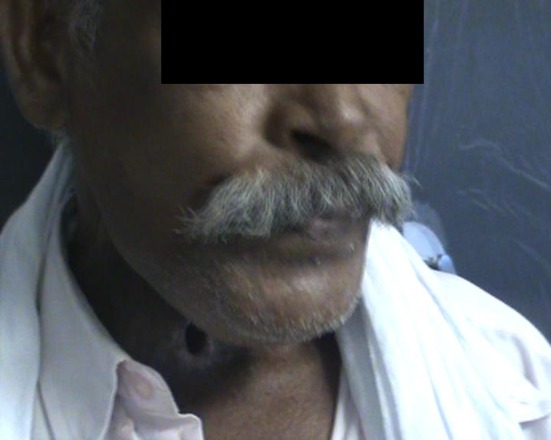
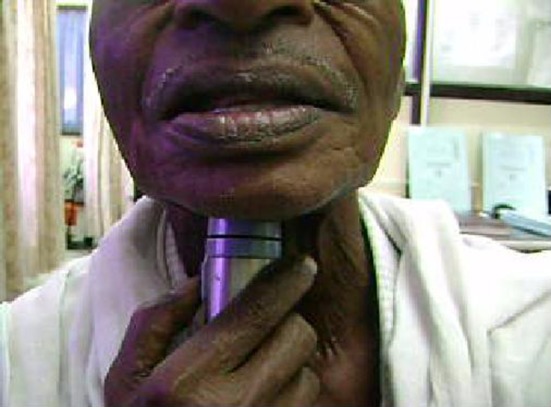
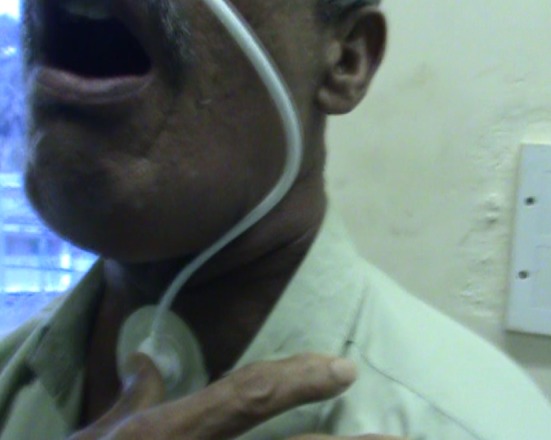
With the approval of the institutional review board of the Regional Cancer Centre (RCC) Trivandrum, India, EORTC QOL questionnaire (QLQ–C30 and QLQ–H&N-35) was distributed among all the consenting patients on followup after laryngectomy from January 2008 to October 2009 [1]. Voice rehabilitation was achieved by near total laryngectomy (NTL), primary or secondary tracheo-esophageal puncture (TEP), Oesophageal speech or electrolarynx (Figs. 1, 2, 3). Esophageal insufflation test (EIT) (Fig. 4) was done prior to selection of cases for oesophageal speech or secondary TEP. The QOL data of voice rehabilitated patients were studied and complications of tracheo-oesophageal voice restoration and their management were recorded (Table 1).
Fig. 1.

Primary TEP
Fig. 2.

Esophageal speech
Fig. 3.

Electro-larynx
Fig. 4.

Esophageal insufflation test (EIT)
Table 1.
Complications of NTL and TEP and their management recorded in the patients who reported their QOL
| Sl. No. | Complications | Methods | No. |
|---|---|---|---|
| 1. | Periprosthesis leak | Resizing of the prosthesis | 2 |
| 2. | Pharyngo-esophageal spasm | Neural block and speech therapy | 2 |
| 3. | Pharyngo-esophageal stricture | Stricture dilatation | 3 |
| 4. | Leakage through the prosthesis | Flap reconstruction | 2 |
| 5. | Granulations around the puncture | Treatment of fungal infection | 3 |
| 6. | Extrusion of prosthesis | Interval replacement | 1 |
| 7. | Spontaneous closure of TE fistula | Re-puncture | 2 |
| 8. | Aspiration (in conservation/NTL) | Swallowing therapy | 2 |
| 9. | Recurrent periprosthesis leakage | Surgical closure of fistula | 1 |
Video cum voice recordings of all consenting voice rehabilitated patients selected randomly from the outpatient department during the study period were stored for speech evaluation. The quality of speech acquired was documented using perceptual and objective parameters. GRBAS scale and intelligibility was used for perceptual quality assessment and maximal phonation time (MPT) for quantitative assessment. GRBAS scale described by Hirano stands for overall grade of hoarseness, roughness, breathiness, asthenicity and strained speech [2] classifying each parameter from a scale of 0–3 signifying normal, mild, moderate and severe. The objective parameters that were recorded included pitch, intensity, jitter and shimmer. Doctors speech and sound forge softwares were employed for the aid of documentation storage and analysis of spontaneous speech samples. Intelligibility, pitch, jitter and shimmer rating of consenting voice rehabilitated patients were recorded, analyzed using Doctor speech software and ranked.
Results
Fiftythree voice rehabilitated patients were studied for their QOL. Voice rehabilitation was achieved either by a primary (8 cases) or secondary TEP (14 cases), electronic larynx (11 cases) or oesophageal speech (2 cases) or by surgical attempts at function preservation (18 cases). The QOL ranking was secondary TEP, esophageal speech, NTL, electronic speech and primary TEP in global health status and functional scores measurements. In symptom scoring the rankings were NTL, esophageal speech, secondary TEP, primary TEP, conservation laryngectomy and electronic speech [1].
During the same study period 23 follow up patients had their speeches analysed for perceptual rating (GRBAS), five of which were electrolarynx, three were NTL, 14 were tracheo-esophageal prosthesis (TEP) and one was oesophageal speech (Table 2).
Table 2.
Perceptual speech analysis (GRBAS rating) of all the consecutive patients studied
| Type of rehabilitation | Sex | Age | G | R | B | A | S | Total |
|---|---|---|---|---|---|---|---|---|
| Primary TEP | M | 23 | 2 | 3 | 2 | 2 | 2 | 11 |
| Primary TEP | M | 52 | 3 | 1 | 3 | 3 | 3 | 13 |
| Primary TEP | M | 72 | 3 | 3 | 2 | 2 | 3 | 13 |
| Electronic larynx | M | 61 | 2 | 3 | 2 | 2 | 3 | 12 |
| Secondary TEP | M | 44 | 2 | 2 | 3 | 2 | 3 | 12 |
| Electronic larynx | M | 78 | 2 | 3 | 1 | 1 | 2 | 9 |
| Secondary TEP | M | 58 | 2 | 2 | 2 | 3 | 3 | 12 |
| Secondary TEP | M | 50 | 2 | 3 | 2 | 2 | 3 | 12 |
| Secondary TEP | M | 45 | 1 | 2 | 1 | 1 | 2 | 7 |
| Electronic larynx | M | 49 | 1 | 2 | 1 | 1 | 2 | 7 |
| Primary TEP | M | 61 | 1 | 2 | 1 | 1 | 1 | 6 |
| Secondary TEP | M | 38 | 2 | 2 | 3 | 2 | 3 | 12 |
| Esophageal speech | M | 52 | 2 | 2 | 1 | 1 | 3 | 9 |
| NTL | M | 55 | 1 | 1 | 1 | 2 | 3 | 8 |
| Primary TEP | F | 45 | 2 | 2 | 3 | 2 | 3 | 12 |
| Primary TEP | M | 61 | 1 | 3 | 2 | 1 | 3 | 10 |
| Electronic larynx | M | 67 | 2 | 3 | 2 | 2 | 3 | 12 |
| NTL | F | 55 | 1 | 1 | 1 | 2 | 3 | 8 |
| Electronic larynx | M | 50 | 1 | 1 | 1 | 1 | 3 | 7 |
| Secondary TEP | M | 55 | 2 | 3 | 0 | 0 | 1 | 6 |
| Primary TEP | M | 60 | 2 | 3 | 1 | 1 | 2 | 9 |
| Primary TEP | M | 58 | 3 | 3 | 0 | 2 | 1 | 9 |
| NTL | M | 45 | 1 | 2 | 1 | 1 | 1 | 6 |
Objective Assessment of Speech
Twentyfour voice recordings (samples) were studied objectively by a senior speech and language therapist. The following parameters were taken into consideration in the objective analysis of speech among the patients studied.
JITTER % gives an evaluation of the variability of the pitch period within the analyzed voice sample (an acoustic measurement of how much a given period differs from the period that immediately follows it).
SHIMMER % gives an evaluation of the variability of the peak–peak amplitude within the analyzed voice sample (shimmer or amplitude perturbations indicates the short term instability of vocal signal).
Table 3 shows the actual values independently assessed by a senior speech and language therapist.
Table 3.
Actual values of shimmer, intensity, pitch and jitter independently assessed by a senior speech and language therapist
| No. | Sex | Age | Type of rehab. | Pitch (Hz) | Intensity (dB) | Jitter (%) | Shimmer (%) | SLT’s comments |
|---|---|---|---|---|---|---|---|---|
| 1 | M | 23 | Primary TEP | 143.0 | 70.3 | 3.5 | 19.8 | |
| 2. | M | 50 | Secondary TEP | 140.9 | 50 | 3.7 | 18.1 | Intensity is less compared to others |
| 3. | M | 38 | Secondary TEP | 194.3 | 67.4 | 4.6 | 21.4 | |
| 4. | M | 72 | Primary TEP | 147.5 | 70.8 | 2.6 | 17.8 | |
| 5. | M | 78 | Electro larynx | 256.7 | 72.8 | 4.2 | 19.6 | Worst voice. Pitch, jitter and shimmer are very high |
| 6. | F | 55 | NTL | 242.8 | 70.5 | 3.4 | 18.0 | May be this is one of the best voice in terms of pitch and intensity. However jitter and shimmer values are a little high |
| 7. | M | 61 | Electro larynx | 115.3 | 69.3 | 1.7 | 14.4 | |
| 8. | M | 61 | Electro larynx | 94.0 | 68.3 | 1.4 | 13.9 | |
| 9. | F | 45 | Primary TEP | 381.9 | 60.7 | 6.8 | 21.2 | |
| 10. | M | 44 | Secondary TEP | 126.4 | 71.8 | 3.3 | 17.9 | |
| 11. | M | 72 | Primary TEP | 178.9 | 65.5 | 2.2 | 17.2 | |
| 12. | M | 55 | NTL | 185.7 | 70.1 | 3.0 | 18.8 | |
| 13. | M | 61 | Primary TEP | 99.4 | 74.1 | 0.7 | 9.7 | |
| 14. | M | 45 | Secondary TEP | 156.2 | 68.9 | 4.8 | 21.4 | |
| 15. | M | 52 | Oesophageal speech | 212.6 | 69.2 | 3.8 | 20.0 | Poor voice. High pitch and low intensity |
| 16. | M | 38 | Electrolarynx | 103.0 | 72.2 | 1.3 | 8.2 | |
| 17. | M | 52 | Secondary TEP | 118.9 | 72.4 | 3.8 | 13.3 | |
| 18. | M | 60 | Primary TEP | 152.9 | 68.6 | 3.1 | 18.5 | |
| 19. | M | 58 | Primary TEP | 182.2 | 78.8 | 2.9 | 17.3 | |
| 20. | M | 70 | Secondary TEP | 439.6 | 74.8 | 5.9 | 20.8 | High variation in pitch from one sample to another. Probably because of the noisy environment |
| 21. | M | 70 | Secondary TEP | 189.9 | 83.9 | 5.2 | 22.2 | |
| 22. | M | 70 | Secondary TEP | 124.6 | 84.1 | 3.5 | 33.1 | |
| 23. | M | 65 | NTLP | 183.3 | 77.0 | 5.0 | 22.8 | |
| 24. | M | 65 | NTLP | 102.2 | 91.2 | 5.3 | 15.4 | May be this is one of the best voice in terms of pitch and intensity. However jitter and shimmer values are little high |
The perceptual qualitative analysis by GRBAS rating (Table 2) showed a ranking of NTL–esophageal speech–electronic speech–secondary TEP–primary TEP in the descending order, the absolute average values being electronic speech—9.4, primary TEP—10.375, secondary TEP—10.17, NTL—7.33, esophageal speech—9. However when intelligibility was taken into consideration the ranking was NTL–TEP–esophageal speech and electronic speech. The corresponding quantitative rating in this analysis with MPT was NTL, TEP, Esophageal speech and electronic speech. On objective ratings, which actually takes into consideration both the qualitative and quantitative attributes of speech, comparison and rating of the speech samples were not possible because the variation in each parameter was different in each sample for e.g. in one patient when the pitch was very high, the other two parameters were comparable and for the other patient, the intensity was low but other two parameters were comparable. Hence it was decided not to rank them based on quantitative analysis. However there was general trend towards better ratings for the NTL patients and poor rating for the EL patients (Table 3).
The speech analysis of the selected patients in the present study revealed that there was a discrepancy between the QOL and speech ranking which could be explained by the morbidity rating recorded.
Discussion
Voice rehabilitation strategy after laryngectomy in an Indian scenario has to be distinctly different from the western world [3–5] as indicated by our evaluation of the QOL questionnaire and study of complications of surgical voice restoration. Non surgical means of voice restoration play an important role in our patients. Compliance rate and the motivation rates are comparable with that of the west [6, 7]. A strategy for cost effective rehabilitation of post-laryngectomy patients taking the social financial and educational background of the patient into consideration has been charted out by us and a post laryngectomy rehabilitation algorithm which will serve as a model for the developing countries and concurs with modern evidence based management of advanced larynx and hypopharynx cancers has been developed by us based on these findings [1, 8].
Based on disease extend technical favorability and financial status of the patient where ever possible we perform a near total laryngectomy (NTL) or total laryngectomy with primary TEP which serves the purpose of immediate voice rehabilitation [8]. If the surgery is complex and TEP is technically unsafe we prefer to advise usage of electronic larynx for voice restoration. If patient can afford follow-up and is weak financially, to bear the recurring costs of EL or TEP, esophageal speech rehabilitation is considered. Trial of oesophageal speech is given in these situations. If surgically suitable after ‘oesophageal insufflation test’ (Fig. 4) in financially affording patients not keen on trial of oesophageal speech, secondary TEP is considered. Secondary TEP is carried out after educating the pros and cons of the procedure to the patient and relatives willing to support him.
We strongly believe that our strategy of recruiting patients judiciously taking into consideration financial, educational, social and supportive background into consideration, besides the generally accepted operative technical consideration has yielded results in terms of better QOL among the rehabilitated patients. If we hadn’t done so we would have faced a higher morbidity and resource drainage of our financially compromised patients.
Conclusions
Acceptable QOL scores among voice-rehabilitated patients is accompanied by significant immediate and long-term morbidity and a cost implication to the patient. The discrepancy between the QOL and speech ranking could be explained by the morbidity rating recorded associated with surgical voice restoration in the present study.
Acknowledgments
We wish to thank Kerala State Council for Science Technology and Environment (KSCSTE) for the financial grant extended to the study and Ms Rekha for secretarial assistance in the preparation of this manuscript and the European Organisation for Research and Training in Cancer (EORTC) for permitting us to use the QOL Questionnaire.
Conflict of interest
None.
References
- 1.Varghese BT, Mathew A, Sebastian P, Iype EM, Vijay A. Comparison of quality of life between voice rehabilitated and nonrehabilitated laryngectomies in a developing world community. Acta Otolaryngol. 2011;131(3):310–315. doi: 10.3109/00016489.2010.526960. [DOI] [PubMed] [Google Scholar]
- 2.Hirano M. Clinical examination of voice. New York: Springer; 1981. pp. 81–84. [Google Scholar]
- 3.Debruyne F, Delaere P, Wouters J, Uwents P. Acoustic analysis of tracheo-oesophageal versus esophageal speech. J Laryngol Otol. 1994;108(4):325–328. doi: 10.1017/S0022215100126660. [DOI] [PubMed] [Google Scholar]
- 4.Eadie TL, Doyle PC. Quality of life in male tracheoesophageal (TE) speakers. J Rehabil Res Dev. 2005;42(1):115–124. [PubMed] [Google Scholar]
- 5.Fukutake T, Yamashita T. Speech rehabilitation and complications of primary tracheoesophageal puncture. Acta Otolaryngol Suppl. 1993;500:117–120. doi: 10.3109/00016489309126193. [DOI] [PubMed] [Google Scholar]
- 6.Fagan JJ, Lentin R, Oyarzabal MF, Isaacs S, Sellars SL. Tracheoesophageal speech in a developing world community. Arch Otolaryngol Head Neck Surg. 2002;128(1):50–53. doi: 10.1001/archotol.128.1.50. [DOI] [PubMed] [Google Scholar]
- 7.Mehta SA, Bachher GK. The Indian experience with immediate tracheoesophageal puncture for voice restoration. Eur Arch Otorhinolaryngol. 1995;252(4):209–214. doi: 10.1007/BF00179913. [DOI] [PubMed] [Google Scholar]
- 8.Varghese BT, Sebastian P, Mathew A. Treatment outcome in patients undergoing surgery for carcinoma larynx and hypopharynx—a follow-up study. Acta Otolaryngol. 2009;129(12):1480–1485. doi: 10.3109/00016480902748520. [DOI] [PubMed] [Google Scholar]


