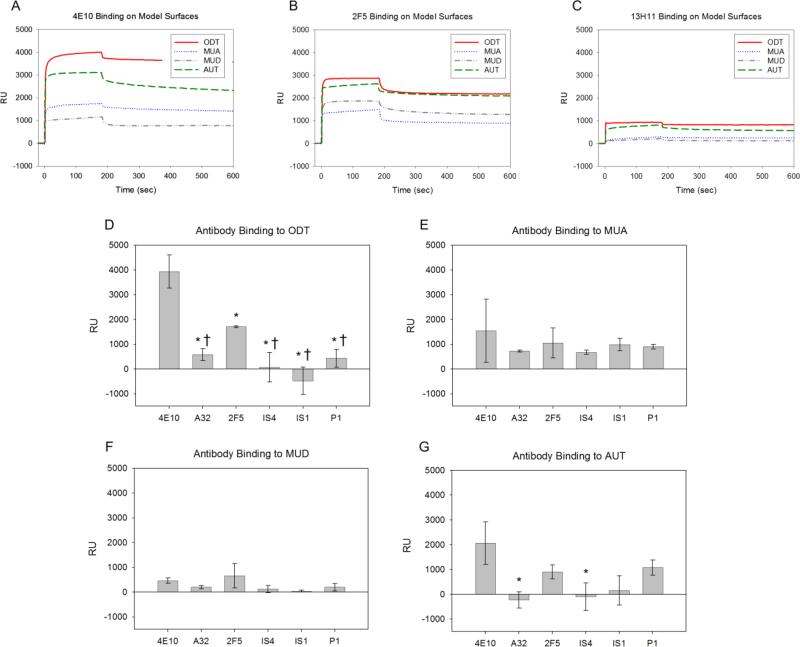
Fig. 2.
Antibody-thiol SPR binding response. A-C. Representative SPR response curves for 4E10, 2F5, and 13H11 (non-lipid reactive control) to model surfaces. D-G. Mean RU value from each antibody grouped for each of the four thiols used. Mean values of at least three independent experiments are shown. * Signifies statistically significant (p<0.05) when compared to 4E10. † Signifies statistically significant (p<0.05) when compared to 2F5. The apparent negative amount of bound antibody is due to RU levels below 13H11 background, which was attributed to nonspecific interactions and subtracted from all RU values.
** Fig. 2 intended for color reproduction on the Web and in print

