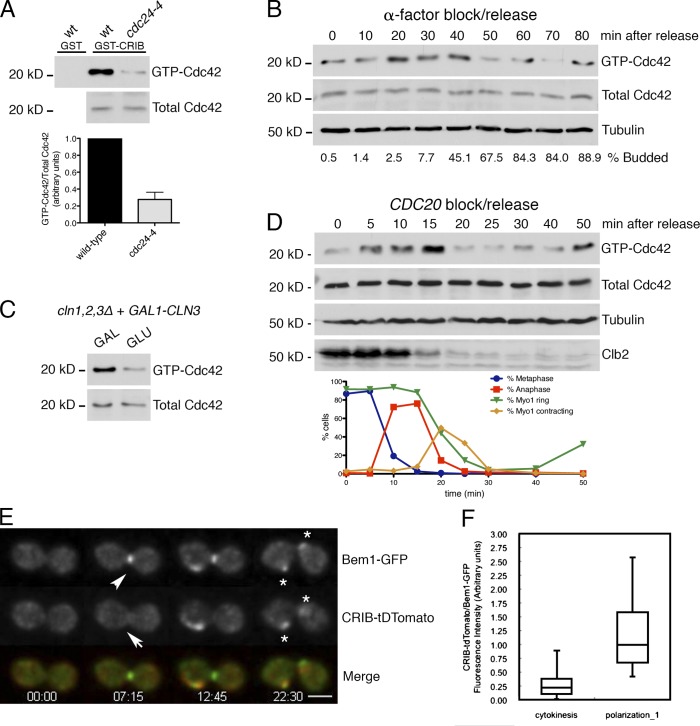
Figure 1.
Cdc42 activity peaks at G1/S and anaphase and is suppressed during cytokinesis. (A) Wild-type (wt) and cdc24-4 ts cells were shifted to 37°C for 2.5 h, and lysates were assayed for GTP-Cdc42 levels by GST-CRIB binding. Graph shows means ± SEM from three experiments, P < 0.01 by unpaired two-tailed t test. (B) bar1Δ cells were released from an α-factor block, and GTP-Cdc42 was measured at the indicated time points. (C) cln1,2,3Δ GAL1-CLN3 cells were split into media containing either galactose (GAL) or glucose (GLU), in which CLN3 expression is repressed. The example is representative of three experiments. (D) GALL-CDC20 GFP-TUB1 MYO1-GFP cells were arrested at metaphase and released. Samples were processed to measure GTP-Cdc42 activation and for microscopy to determine cell cycle stage. The example is representative of three experiments. (E) Time-lapse imaging of a CRIB-tdTomato BEM1-GFP cell undergoing mitotic exit. Image 00:00 (minutes and seconds) is 1 h after release from hydroxyurea. Bar, 5 µm. During cytokinesis, little CRIB-tdTomato (arrow) localizes to the bud neck relative to Bem1-GFP (arrowhead); both localize to the subsequent bud sites (asterisks). (F) Quantification of CRIB-tdTomato/Bem1-GFP intensity ratio during cytokinesis and polarization. Lines are medians, top and bottom edges indicate 25th and 75th quartiles, and whiskers are the highest and lowest measurements.

