Figure 4.
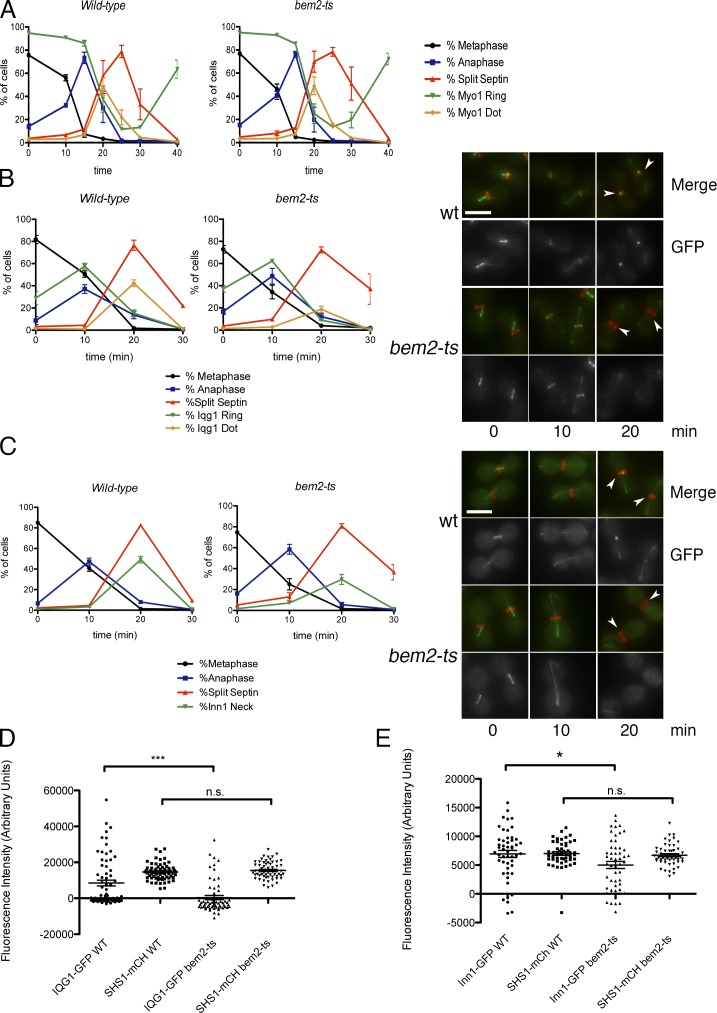
Inefficient localization of Iqg1 and Inn1 during cytokinesis in bem2-ts cells. (A) MET3-CDC20 GFP-TUB1 SHS1-mCherry MYO1-GFP strains with or without bem2-ts were synchronized as in Fig. 3 E. Graph shows means ± SEM for three experiments. (B) Similar strains as in A but with IQG1-GFP were synchronized as in Fig. 3 E. IQG1-GFP, if present at the bud neck, was scored as either being a ring or contracted dot. The percentage of cells with the indicated localization pattern is plotted as means ± SEM from three experiments. (right) Representative images of cells. Arrowheads show Iqg1 bud neck localization. (C) Similar strains as in A but with INN1-GFP. Percentage of Inn1 neck represents percentage of cells with Inn1-GFP at the bud neck. (right) Representative images of cells from the indicated time points. Arrowheads show Inn1 bud neck localization. (D) Scatter plot of Iqg1-GFP and Shs1-mCherry background-corrected fluorescence intensity at the bud neck in bem2-ts cells 20 min after release from CDC20 arrest in SHS1-mCherry IQG1-GFP cells. Note that negative values after background subtraction indicate either increased cytoplasmic background or completion of cytokinesis with a corresponding loss of background signal in the bud neck area. Lines indicate means, and error bars represent SEMs; n > 60 cells. The difference for Iqg1-GFP intensity between wild type (WT) and bem2-ts was statistically significant (P < 0.0001 by unpaired two-tailed t test), whereas the difference for Shs1-mCherry (mCh) was not significant. (E) Inn1-GFP fluorescence intensity at the bud neck was measured as in D; n > 50 cells. The difference for Inn1-GFP was significant (P < 0.05 by unpaired two-tailed t test). Bars, 5 µm.

