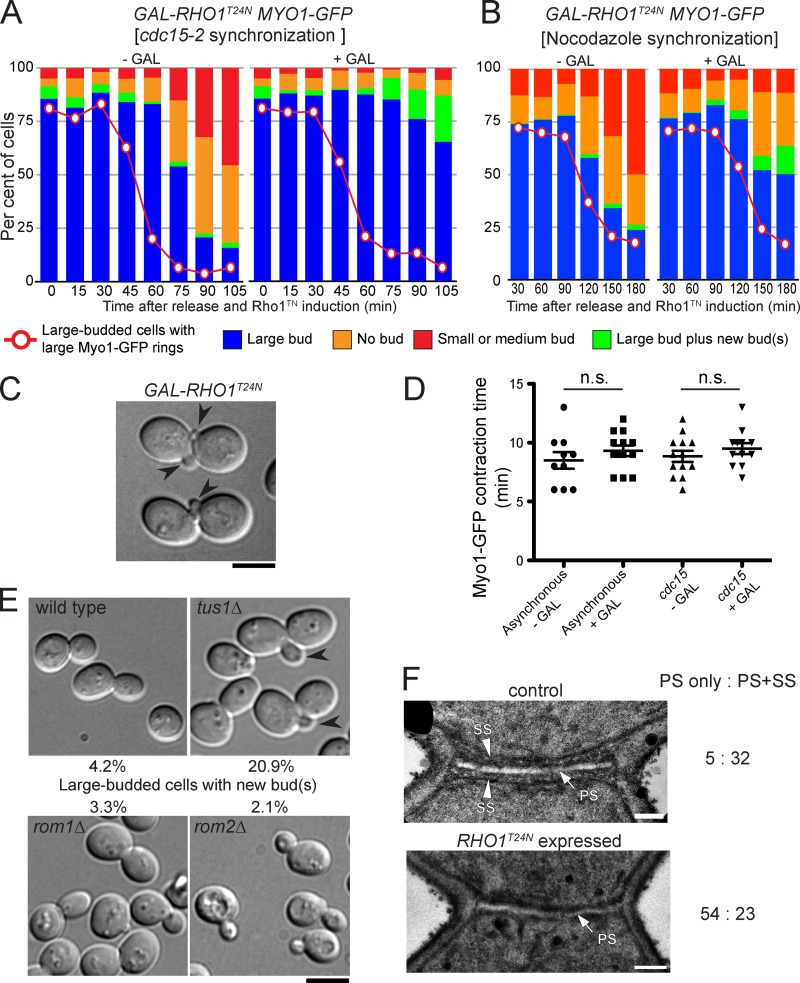
Figure 4.
Dependence of SS formation and cell separation, but not cleavage-furrow ingression, on Rho1 activity. (A–D) Effects of dominant-negative Rho1. A cdc15-2 MYO1-GFP (YCp-PGAL-RHO1T24N) strain (MOY542) was synchronized by incubation at 37°C in SC-Leu (2% raffinose) medium (A, C, and D, right) or with nocodazole in YPD (2% raffinose) medium (B; see Materials and methods). Each culture was separated into two and released from the block in the presence (+GAL) or absence (−GAL) of 2% galactose. (A and B) At the indicated times, aliquots of cells were fixed with formaldehyde, sonicated briefly, and scored for the percentages of cells with large (precontraction) Myo1-GFP rings, large buds, large buds plus one or more new buds, no buds, and small or medium buds (n > 200 per sample). Plasmid loss during incubation in the nonselective medium presumably accounts for the reduced efficiency of cell separation blockage in B. (C) Representative cells at 105 min in the +GAL culture of A. Arrowheads show new buds formed before cell separation. (D) Asynchronous cells in SC-Leu (2% raffinose) medium and cdc15-2–synchronized cells were observed by time-lapse microscopy beginning 15 min after addition (or not) of galactose. The time intervals between initiation of Myo1-GFP contraction and Myo1-GFP disappearance were recorded as constriction times. The long and short horizontal bars indicate means and means ± SDs, respectively. Student’s unpaired t tests showed that the differences in mean values were not significant. Data from three separate experiments were combined; n = 10, 12, 13, and 12 (left to right). (E) Cell morphologies of Rho1 GEF mutants. Strains of the indicated genotypes (YEF473A, RNY879, RNY935, and RNY875) were cultured in YM-P medium to exponential phase. Arrowheads show new buds formed before cell separation. The percentages of such cells among total large-budded cells are indicated (n = 300). (F) Effect of Rho1T24N on septum morphology. Control (−GAL) and Rho1T24N-expressing (+GAL) cells from the 75-min sample in A were observed by EM. Counts of septa with PS only or with both PS and SS are shown on the right. Bars: (C and E) 5 µm; (F) 0.2 µm.

