Figure 8.
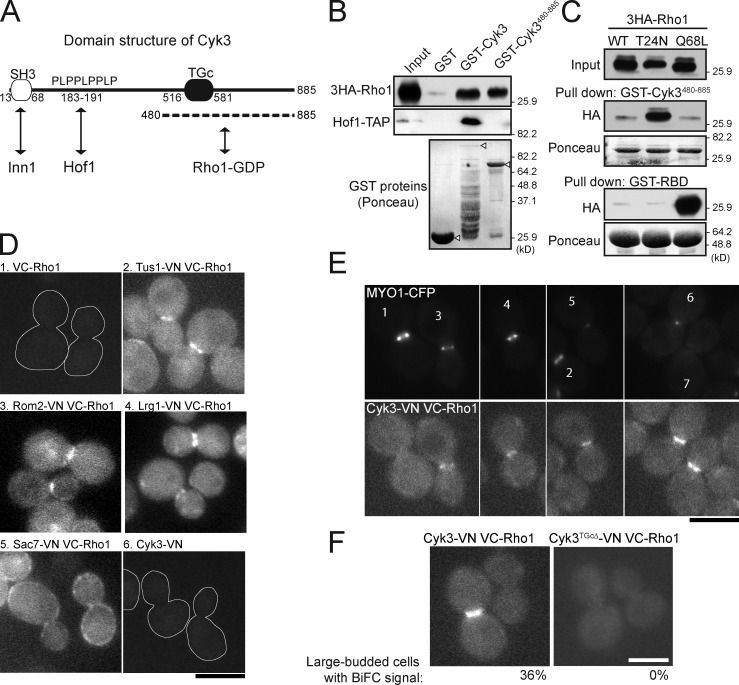
Physical interaction between Cyk3 and Rho1. (A) Domain structure of Cyk3. SH3, src-homology domain; PLPPLPPLP, proline-rich motif; TGc, transglutaminase core domain. The previously known interactions with Inn1 and Hof1 and the interaction with Rho1 identified in this study are indicated. (B) Cells expressing 3HA-tagged Rho1 (MOY522) were grown to exponential phase in YM-P medium at 24°C, and pull-down was performed (top) using bacterially expressed GST, GST-Cyk3, or GST-Cyk3480–885 (see Materials and methods). Hof1-TAP (strain MOY22) was included here as a control (middle) because Hof1 is known to bind to the PLPPLPPLP motif of Cyk3 (unpublished data). (bottom) The GST proteins used were also analyzed by SDS-PAGE; the arrowheads indicate the full-length proteins. (top) Note that there appears to have been relatively little full-length GST-Cyk3 (because of proteolysis or premature translation termination), yet pull-down by this preparation was quite effective. This may mean that binding of Cyk3 to Rho1 normally involves a site in the N-terminal region as well as that in the C-terminal region. The migration positions of molecular mass markers are indicated. (C) Selective affinity of the Cyk3 C terminus for Rho1-GDP. 3HA-tagged wild-type (WT; strain MOY801), dominant-negative (T24N; strain MOY824), and constitutively active (Q68L; strain MOY803) Rho1 proteins were expressed under the control of the GAL1 promoter for 30 min at 24°C. Cell extracts were analyzed as in B using GST-Cyk3480–885 or (as a control) the GST-tagged RBD (Fig. 6). (D–F) BiFC revealing interactions between Rho1 and other proteins. Strains expressing the indicated proteins (MOY1247, MOY1269, MOY1293, MOY1294, MOY1275, MOY1321, MOY1349, MOY1325, and MOY1384) were grown to exponential phase in SC-Leu liquid medium at 24°C and observed by fluorescence microscopy. (D and E) Numbering is for ease of reference in the text. Cell outlines are shown in 1 and 6 where there is no fluorescence signal. (F) The percentage of large-budded cells with detectable BiFC signal at the bud neck is shown for each strain. Bars, 5 µm.

