Figure 3.
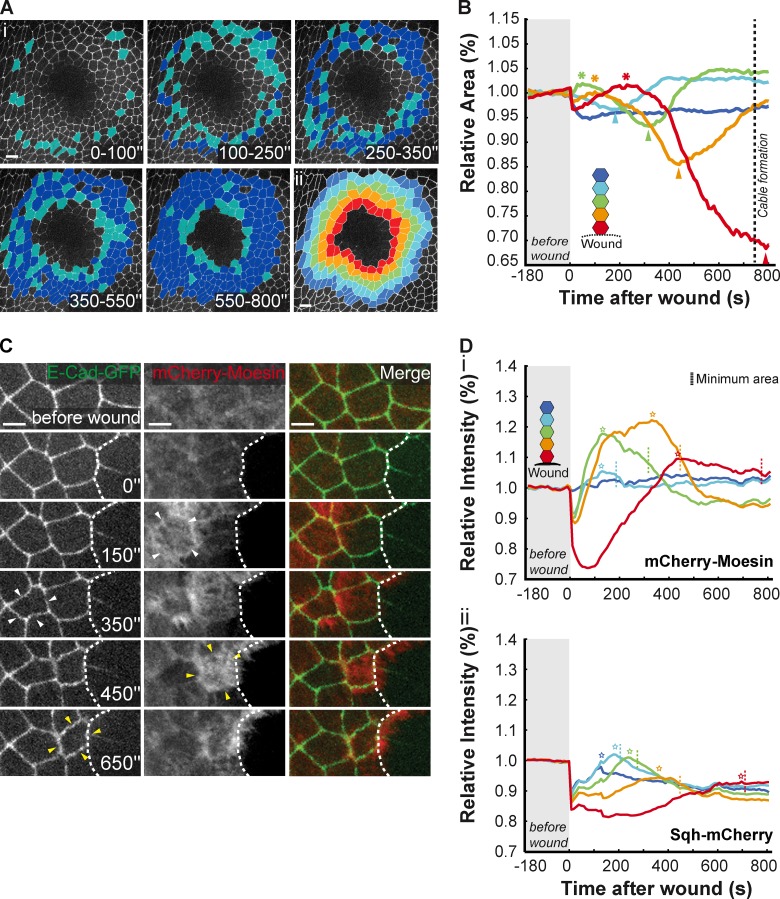
Coordinated actin and myosin flows provide the driving force for apical cell constriction. (Ai) Movie stills of the initial stages of wound healing illustrate that the early contraction wave assumes a circular shape. Cells that constrict during the indicated time intervals are highlighted in light blue. Dark blue shows all cells that have contracted since the beginning of wound healing. (Aii) Representative image of the wounded tissue shown in Ai highlighting a color code that represents distance in number of cell rows to wound. Rows close to the margin are colored in red and the following rows are colored in the sequence: yellow, green, light blue, and dark blue. Bars: (i and ii) 10 µm. (B) Graph representing changes in relative cell area during the initial stages of wound healing. Asterisks indicate the maximum area that follows the initial cell expansion. Arrowheads highlight maximum constriction of each cell row revealing that cells closer to the wound margin contract later. Color code represents distance to the wound according to Aii. (C) Stills of an E-cadherin–GFP and mCherry-Moesin movie illustrating that cell constriction follows actin assembly in progression toward the wound margin (dashed line). Bar, 5 µm. White arrowheads highlight a cell that first shows an increase in actin followed by constriction. Yellow arrowheads show a similar pattern visible in the next cell moments later. (Di) Graph representing the variation of actin intensity with time during the initial stages of wound healing. Asterisks highlight maximum actin concentration of each cell row revealing that cells closer to the wound reach their maximum actin concentration later compared with cells further away from the wound. Corresponding time points of minimum area/maximum constriction are marked with a dashed line. (Dii) Graph representing the variation of myosin intensity with time during the initial stages of wound healing. Asterisks highlight maximum myosin concentration of each cell row revealing that cells closer to the wound reach their maximum myosin concentration later. Corresponding time points of minimum area/maximum constriction are marked with a dashed line. Color code in Di and Dii correspond to Aii.

