Figure 4.
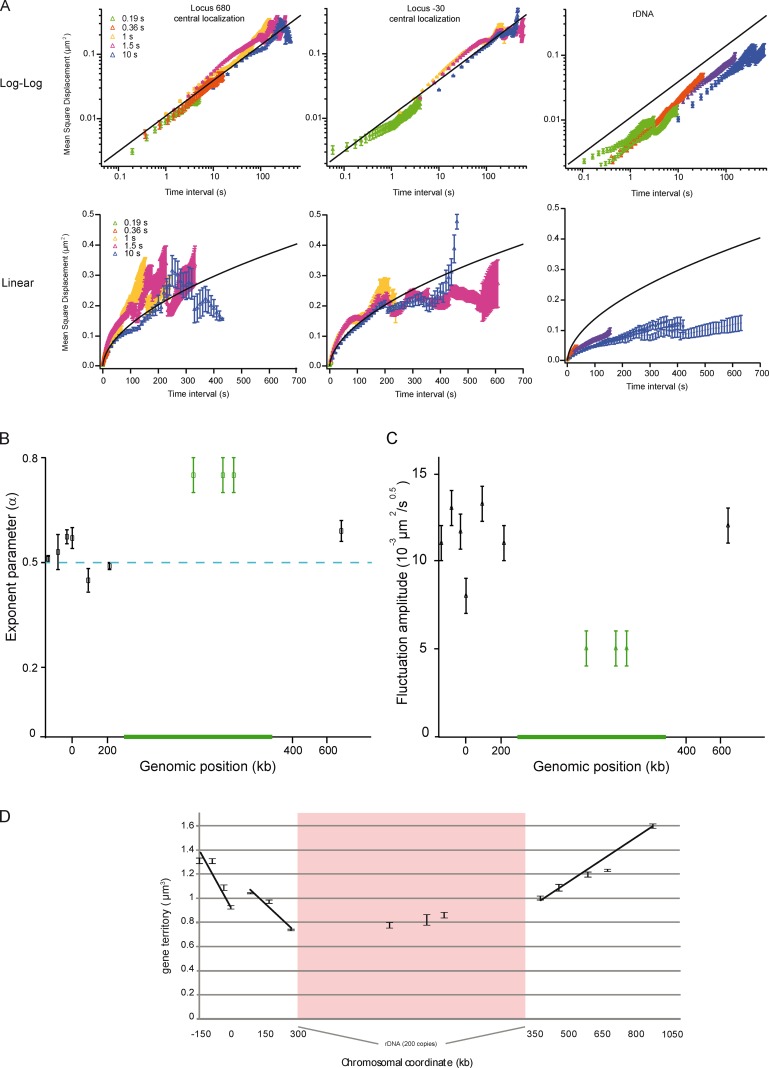
Loci motion is slowed down at NUC, and homogeneous elsewhere. (A) The temporal evolution of the MSD is plotted at position 680 kb, −30 kb (for central localization), and at rDNA (nucleolar localization) in log-log (top) or linear (bottom) scale. MSD extracted from time lapse of 0.19-, 0.36-, 1-, 1.5-, and 10-s inter-frames are depicted in different colors. The curves are fitted with an anomalous diffusion model (solid lines), showing that the anomaly parameter is 0.5 ± 0.07. Note that the movements of rDNA are slow in comparison to those of the locus at 680 or −30 kb. The black line represents the fit to the dataset with a power-law scaling of 0.55. (B) The plot represents the anomaly parameter versus the genomic position, and shows the different dynamics in NUC for the 10 analyzed loci. (C) Spatial fluctuations of the 10 analyzed loci are compared by measuring the amplitude of the power-law scaling response using a model with Γt0.5. (D) The gene territory, defined by the volume occupied by 50% of the gene population (the green isocontour in gene maps) expressed in cubic micrometers is measured as a function of the genomic position. Gene territory experimental errors were determined by measuring gene territories from three samplings of the full dataset.

