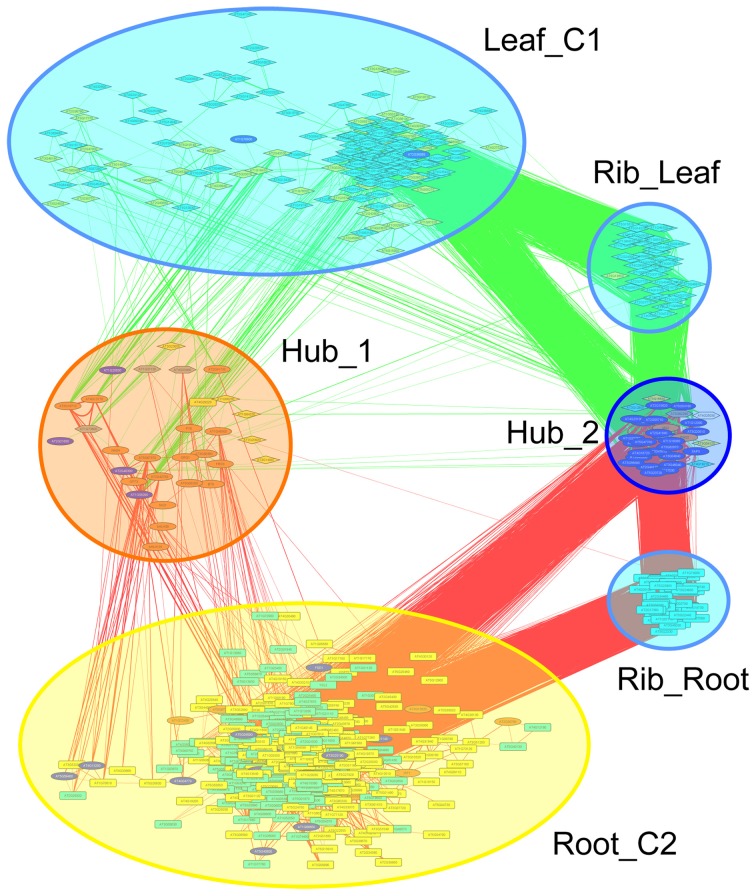
Figure 3.
Merged co-expression network of differentially expressed genes in roots and leaves. Differentially expressed genes were first clustered separately for roots and shoots based on their co-expression relationships with a Pearson's coefficient of ≥0.60 against a customized data base that was constructed from experiments conducted with roots or leaves, respectively, using the MACCU software package, and then the two networks were combined. Yellow nodes denote genes that were up-regulated in roots or shoots, orange nodes indicate genes with increased expression in both organs. Light blue nodes denote genes that were down-regulated in roots or shoots, dark blue nodes indicate genes with decreased expression in both organs. Red and green lines represent co-expression edges derived from the root or leaf networks, respectively.

