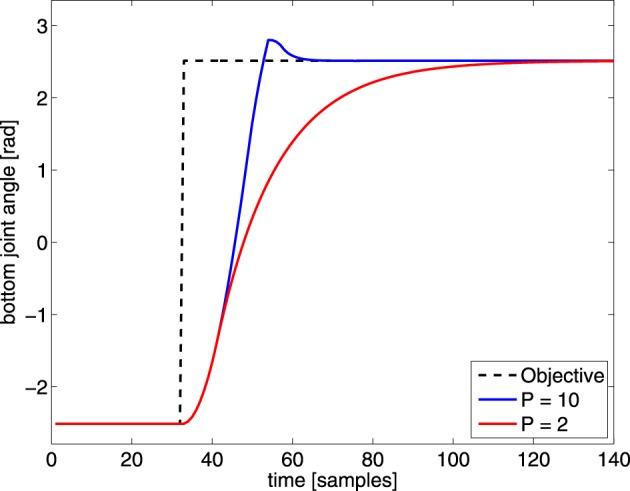
Figure 4.

Illustration of a sudden change in desired joint-angle of the bottom joint (black dashed line) of the PUMA 500. The robot response is shown for this particular joint with different P-parameters, to illustrate the effect of a changed P value. By decreasing the P-parameter the dynamic transition time from one position to the other increases.
