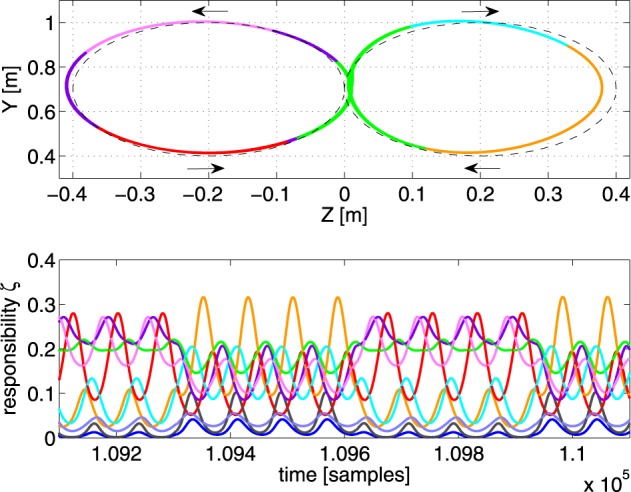
Figure 8.

Illustration of the tracking performance of MACOP with 9 linear controllers after convergence. Top panel: the resulting trajectory, colored according to the dominant controller. The dashed line is the target. Bottom panel: the corresponding responsibilities as a function of time.
