
Figure 3.
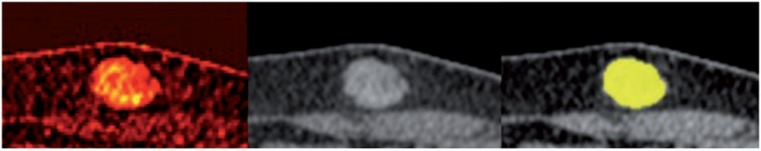
Iodine uptake visualization of subcutaneous metastasis (left), demonstrating the inhomogeneous uptake of contrast medium. Center: mixed image, corresponding to a standard 120 kV contrast-enhanced image. Right: result of semi-automatic segmentation is displayed in yellow.