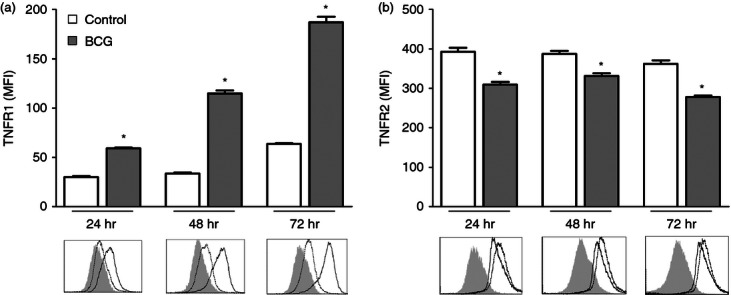
Figure 1.

Surface tumour necrosis factor receptor (TNFR) expression in J774A.1 cells after Mycobacterium bovis bacillus Calmette–Guérin (BCG) infection. J774A.1 macrophages were either mock-infected or infected with M. bovis BCG at a multiplicity of infection (MOI) of 10 : 1. After 24, 48 and 72 hr, cells were stained with FITC-conjugated anti-mouse TNFR1 (a), or phycoerythrin-conjugated anti-mouse TNFR2 (b) and analysed by flow cytometry. The intensity of TNFRs was expressed as the mean fluorescence intensity (MFI) of at least 10 000 cells per sample. Representative histograms show TNFR1 or TNFR2 surface expression on mock-infected cells (dotted line) and BCG-infected cells (black line) or isotype control (light grey-filled area). The means and standard errors from one representative experiment of at least three is shown. *P < 0.001 versus mock-infected control.
