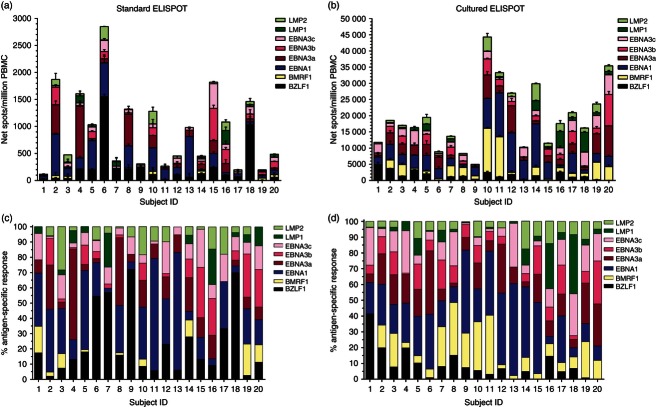
Figure 3.
Magnitude and distribution of Epstein–Barr virus (EBV)-specific T-cell responses in healthy subjects. The magnitude of standard (a) and cultured (b) ELISPOT responses in peripheral blood mononuclear cells (PBMC) from each EBV-seropositive healthy subject to peptide pools (15 amino acids in length with an 11-amino-acid overlap) representing the full-length lytic (BZLF1 and BMRF1) and latent (EBNA1, EBNA3a, EBNA3b, EBNA3c, LMP1 and LMP2) EBV proteins are shown. Results are shown as net spots/million PBMC. Error bars represent the SD of the mean. The specific response to each EBV antigen as a percentage of the total summed EBV-specific standard (c) and cultured (d) ELISPOT responses are shown.

