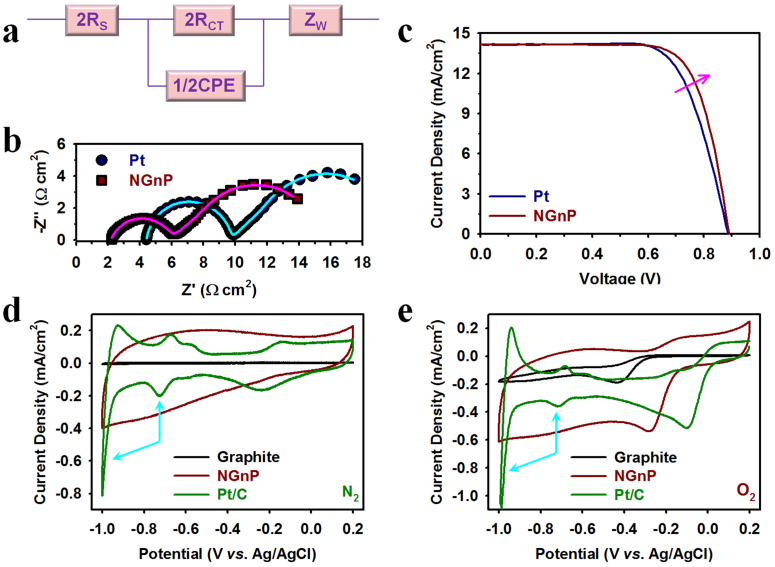
Figure 4.
(a) Equivalent circuit diagram for fitting the EIS data. (b) Nyquist plots of EIS spectra measured at 0 V from 106 Hz to 0.1 Hz on dummy cells of Pt and NGnP, and solid lines are fitted curves. (c) Current-voltage characteristics of DSSCs with the Pt-FTO and NGnP-FTO CEs under simulated AM 1.5 light. The TiO2 film thickness and active area are 9(6 + 3) μm and 0.16 cm2 with a black metal mask, respectively. Cyclic voltammograms (CV) of samples on glassy carbon (GC) electrodes with a scan rate of 0.01 V/s: (d) in N2-saturated 0.1 M aq. KOH solution; (e) in O2-saturated 0.1 M aq. KOH solution. Sky blue arrows indicate the contributions of hydrogen evolution at around −0.7 V and out of Pt limiting potential (−0.8 V).

