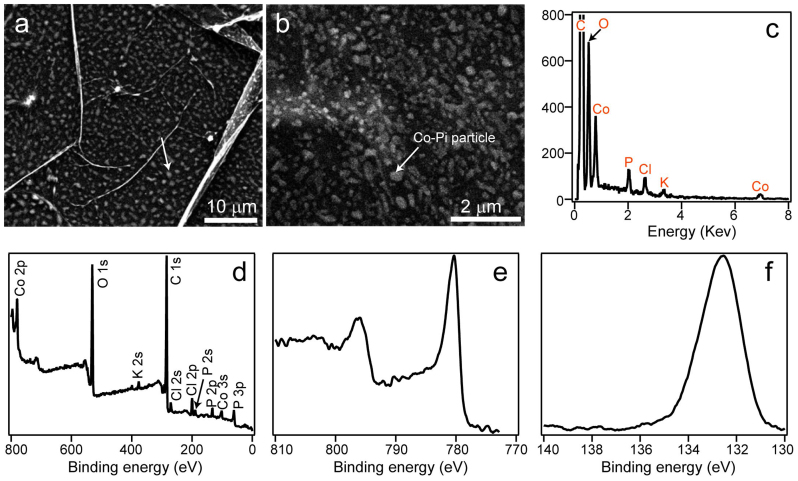
Figure 2. Characterization of rGO-Co-Pi.
SEM images of spotted fabric-like rGO-Co-Pi obtained by direct electrodeposition technique at (a) low and (b) high magnification showing the uniform distribution of Co-Pi particles on rGO nanosheet; (c) EDX spectrum showing the elemental composition of the resultant rGO-Co-Pi; (d) XPS survey spectrum, (e) high resolution Co 2p and (d) P 2p spectrum for rGO-Co-Pi. Signals arising from rGO nanosheet and Co-Pi were mainly detected. The Cl signals are due to trace residual CoCl2 on the surface.

