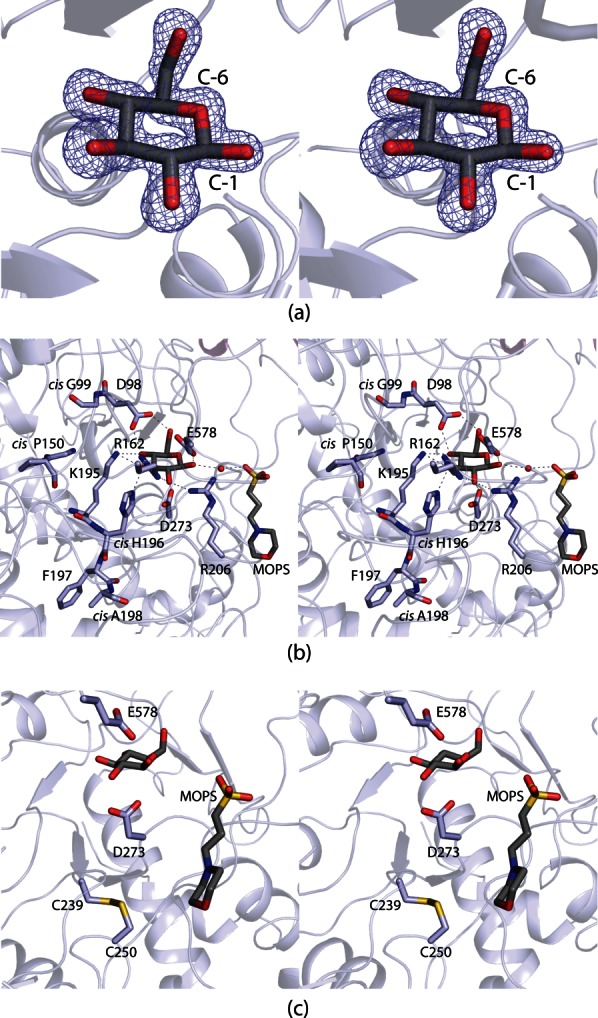
Figure 3.

The DesR active site. Electron density corresponding to the bound d-glucose ligand is shown in (a). The map, contoured at 2σ, was calculated with coefficients of the form (Fo − Fc) where Fo was the native structure factor amplitude and Fc was the calculated structure factor amplitude. The DesR model used for the calculation was refined to reduce model bias from the molecular replacement procedure. Those amino acid residues or solvent molecules lying within 3.2 Å of d-glucose are shown in (b). An ordered water molecule is depicted as a red sphere. Possible hydrogen bonding interactions between the carbohydrate and the protein are indicated by the dashed lines. A MOPS buffer was observed binding at the opening of the active site cleft. A close-up view of the disulfide bridge that flanks one side of the active site pocket is presented in (c).
