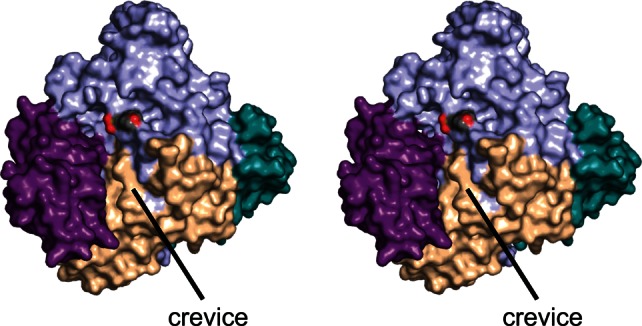
Figure 4.

Surface representation of DesR. The color-coding is as described in Figure 2. The oxygens of the MOPS buffer are displayed in red. There is a decided cleft formed at the interface of the core region and Domain A (violet), which leads directly from the active site.
