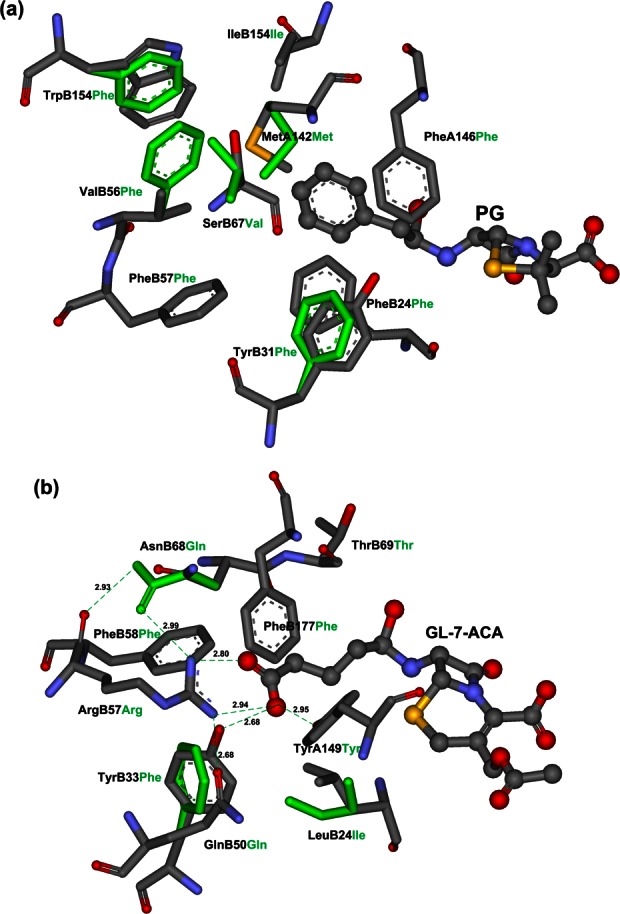
Figure 4.

The maximum recovered design results for PGA and CA, and only TS and residues at primary design sites are shown. (a) PGA; (b) CA. The TS small molecules are shown in ball and stick model, and O/N/C/S atoms are shown in red/teal/gray/orange. The primary binding residues are shown in stick models, the wild-type residues are shown in colors of their atoms and labeled in black, and the designed residues are shown in cyan and labeled in cyan. The hydrogen bonds formed in active site of CA are shown by cyan dotted lines, and the distances between donors and acceptors are shown in Å. [Color figure can be viewed in the online issue, which is available at http://wileyonlinelibrary.com.]
