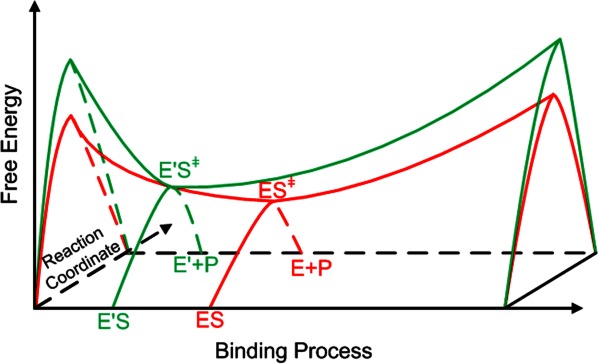
Figure 5.

Saddle point on free energy surface for enzymatic reaction system, where ES represents Michaelis complex of native enzyme E and substrate S, and ES≠ stands for the transition state of ES. E′ represents the designed enzyme and P represents the product of reaction. The valley curve refers to the binding process between enzyme active site and transition state of substrate, and the peak curve refers to the reaction coordinate. [Color figure can be viewed in the online issue, which is available at http://wileyonlinelibrary.com.]
