
Figure 2.
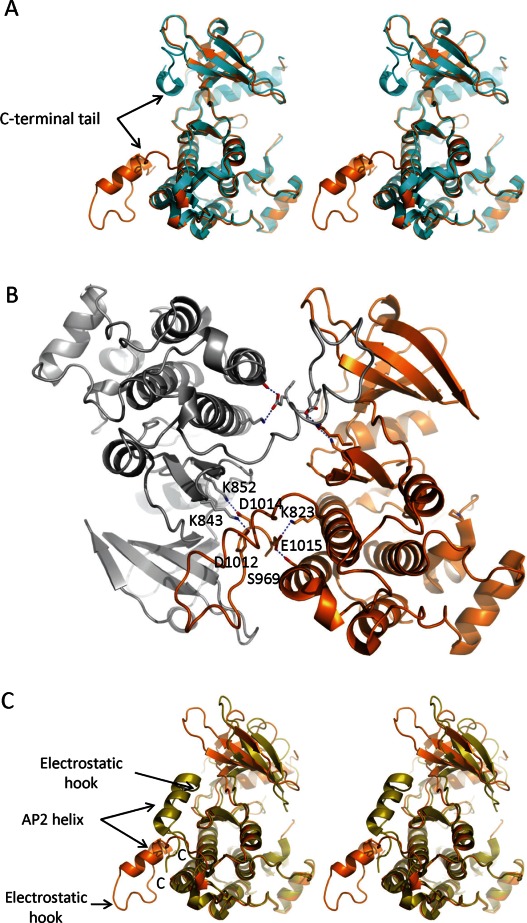
Different models of the EGFR C-terminal tail. (A) Comparison of the different models for the C-terminal tail in stereo view. The revised model for the C-terminal tail (PDBID: 4G5J) is shown in orange; the model in cyan is representative of the most structures of the active EGFR kinase domain in the public domain. (B) Revised model of the C-terminal tail shows extensive intra- and intermolecular interactions. The C-terminal tail of one molecule extensively interacts with the N-lobe of the symmetry-mate. The symmetrymates in the crystal lattice are shown in orange and gray. Some of the specific reciprocal interactions are highlighted. (C) Differences between the C-terminal tails of active and inactive states of the EGFR kinase domain shown in the stereo view. Src/CDK-like inactive state is highlighted in olive (PDBID: 3GT8) and the active state in orange (4G5J). The AP2 helix is maintained in both states, but in opposite orientations. [Color figure can be viewed in the online issue, which is available at http://wileyonlinelibrary.com.]