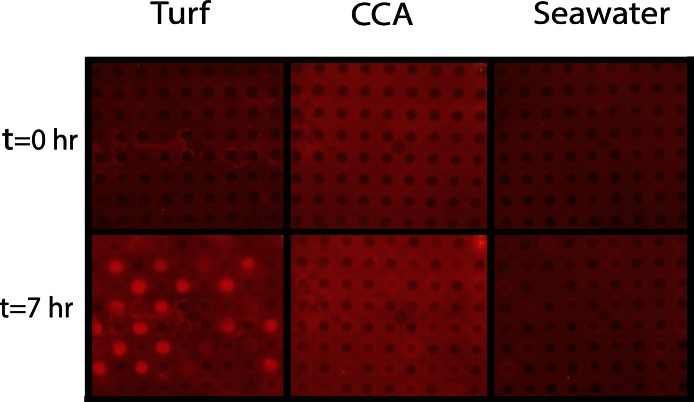
Figure 4. Experimental biological oxygen demand (BOD) plates.
Tinitial and Tfinal (after 7 h) images of BOD plates in turf exudate, CCA exudate, and seawater incubations. Bacterial inoculum was distributed in checkerboard pattern starting with the first well containing bacteria. The increase in red luminescent signal is correlated with a decrease in oxygen concentrations.

