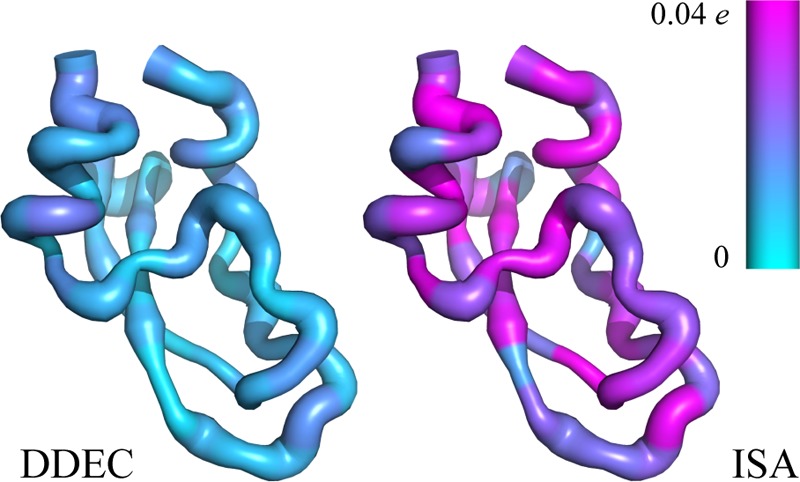
Figure 8.

DDEC/ONETEP charge and conformation fluctuations for nine NMR models of BPTI. Average positional fluctuation per residue is represented by its putty width and average charge fluctuation (standard deviation) per residue by its color. ISA charge fluctuations have been clipped at 0.04 e for visual clarity (ten residues in the ISA method have values greater than 0.04 e, with a maximum of 0.06 e). ISA charges are DDEC/ONETEP charges derived with χ = 0 (eq 7).
