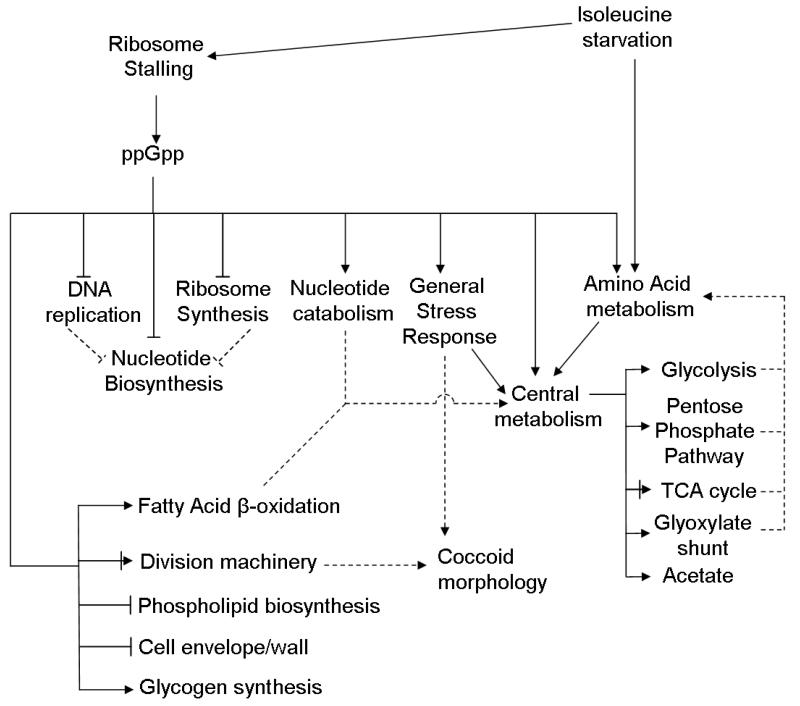
Fig. 8.
Physiological model of the ppGpp-mediated response to isoleucine starvation. Solid arrows represent positive regulation while solid lines with flat ends indicate negative regulation. Solid lines ending with both lines and arrows denote complex regulation. Dashed lines indicate functional effects (eg. Nucleotide catabolism generates intermediates which are funneled into central metabolism). Regulatory relationships are not necessarily direct.

