
Figure 3.
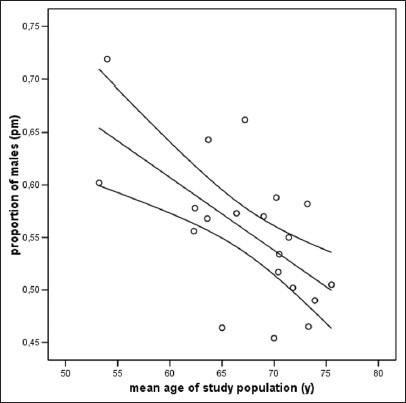
Scatter plot showing the inverse correlation between the proportion of male patients in the respective study population and the mean age of the study population for hospital-based stroke registries from 20 different countries [see also Table 2]