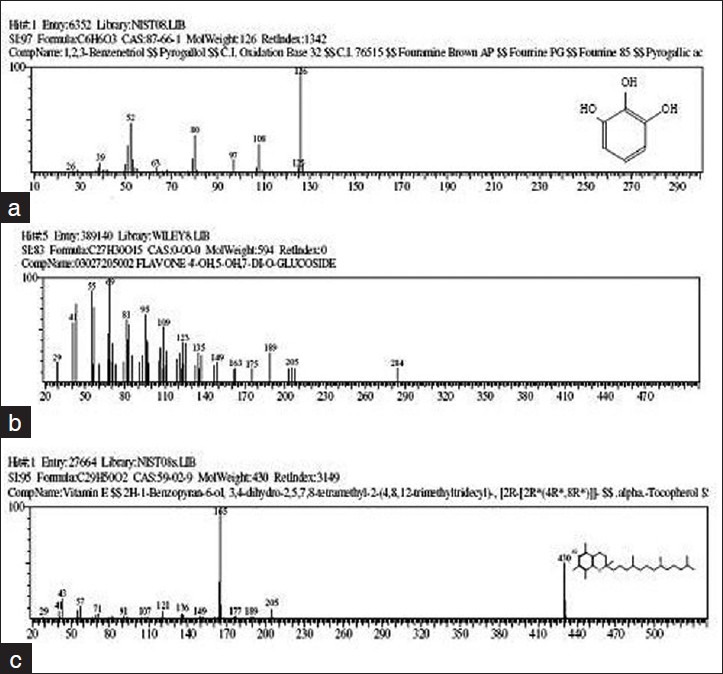
Figure 2.

Mass spectrums (a) The GC-MS spectrum gives the structure of the pyrogallol, molecular formula (C6H6O3), molecular weight 126.0 (b) Mass spectrum of Kaempferol-3-O-rutinoside (c) The GC-MS spectrum gives the structure of the vitamin E, molecular formula (C29H50O2), molecular weight 430
