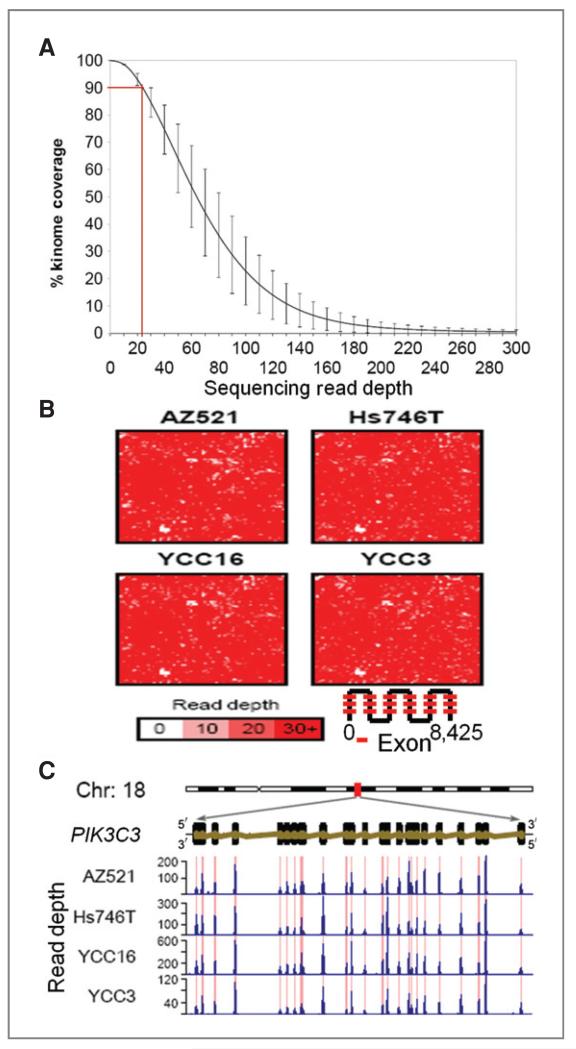
Figure 1.
Genomic coverage of targeted sequence capture and deep sequencing. A, overall cumulative kinome coverage for 14 GC cell lines. Results presented represents sequences retained after filtering (see Methods). The Y-error bars indicate the standard deviation of the corresponding read depths across the 14 lines. B, Hilbert curve plots reflecting coverage of the 8,425 targeted exons in representative cell lines. The color bar indicates the depth of coverage. C, genomic organization, structure, and deep sequencing read distribution of a representative kinase, PIK3C3. Red lines indicate regions of genomic capture. Blue histograms indicate read depth per nucleotide.

