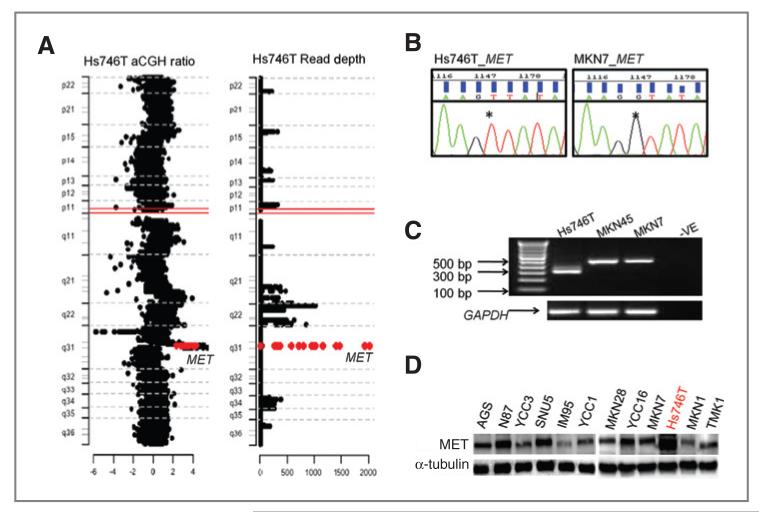
Figure 6.
Integrative analysis of MET genetic alterations. A, plot of chromosome 7 showing a region of exceptionally high read depth corresponding to the MET locus (red labeled) from targeted deep sequencing in Hs746T (right). Confirmation of MET focal amplification in the same cells from aCGH data (left). B, sequencing chromatograph showing a homozygous G>T substitution at the canonical 5′ splice site of the intron 13 of MET in Hs746T, compared with wild-type cell lines. C, RT-PCR results showing an approximately 150-bp shorter MET transcript in Hs746T cells, compared with control cell lines. D, Western blot of MET protein in GC cell lines.

