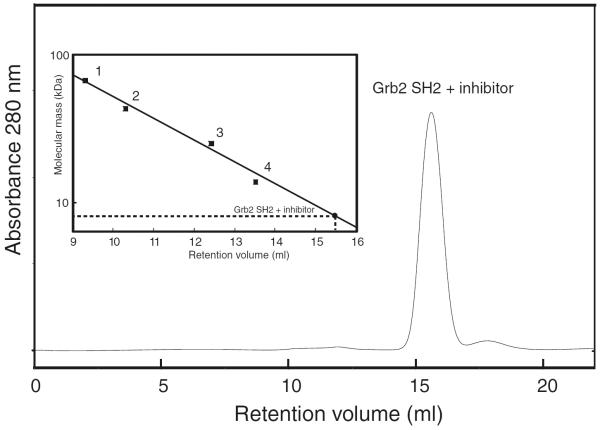
Fig. 1.
Analytical size exclusion chromatography profile for Grb2 SH2 and the macrocyclic inhibitor complex. The inset showed the calibration curve for molecular mass using standard proteins: bovine serum albumin (67 kDa, point 1), ovalbumin (43 kDa, point 2), chymotrypsinogen (25 kDa, point 3), and RNase A (13.7 kDa, point 4). Grb2 SH2 and the macrocyclic inhibitor complex eluted at a position corresponding to a molecular mass of ~9 kDa

