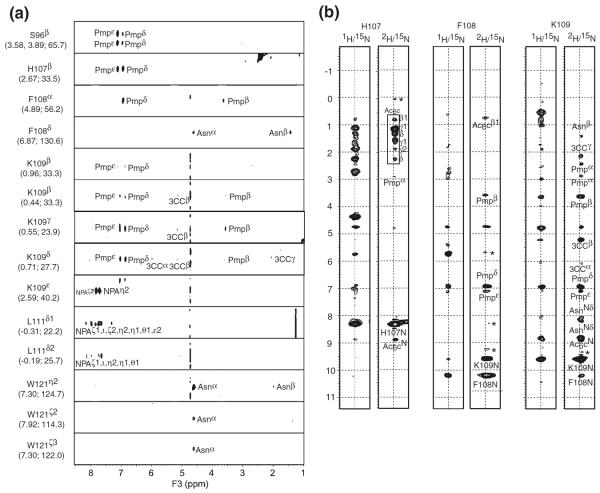
Fig. 4.
(a) Strip plots of 1H-1H planes extracted from a 3D 13C-filtered NOESY spectrum recorded using the complex of the inhibitor and 13C/15N-labeled Grb2 SH2 domain in a 90% H2O solution. Signals at 4.75 ppm on the F3-axis arised from the solvent. The resonance assignments and corresponding 1H and 13C chemical shifts of Grb2 SH2 domain were given in each strip. Intermolecular NOE correlations between the inhibitor and Grb2 SH2 domain were annotated. (b) Strip plots of 1H-1H planes extracted from 3D 15N-edited NOESY recorded using a complex of the inhibitor and the 2H/15N-labeled Grb2 SH2 domain in a 90% H2O solution. Intermolecular NOE correlations between amide protons of Grb2 SH2 and the inhibitor were labeled. Note that the intramolecular NOE correlations of amide-amide pairs of Grb2 SH2 domain were also observed. Signals at 4.75 ppm on the F1-axis arised from the solvent. Asterisk showed the artifact noise

