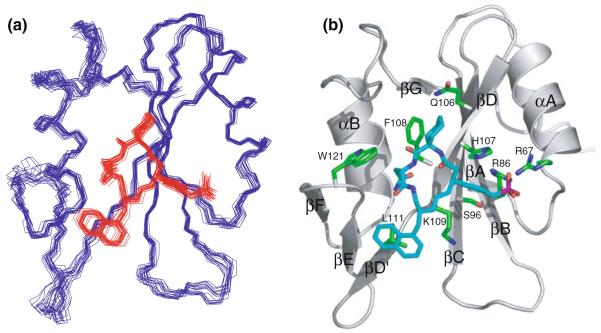
Fig. 5.
(a) Superposition of the 20 lowest energy structures of the Grb2 SH2 domain complexed with the inhibitor. Residues 60–152 of the Grb2 SH2 domain and the inhibitor were colored blue and red, respectively. Structures were superimposed by least square fit to average N, Cα, and C′ coordinates of residues 60–152 of the Grb2 SH2 domain. (b) Ribbon model of the minimized and averaged structure of Grb2 SH2 domain complexed with the inhibitor (blue), where the side chains of protein residues involved in the binding interactions were shown in green. The regular secondary structural elements of Grb2 SH2 domain were labeled

