
Fig. 6.
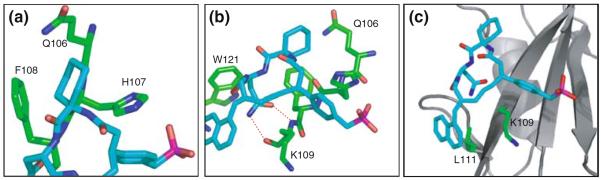
Details of the interaction between the inhibitor and the binding site of Grb2 SH2 domain. (a) pTyr+1 site; (b) pTyr+2 site; (c) pTyr+3 site. The inhibitors were shown as a stick model (cyan). Gln106, His107, Phe108, Lys109, Leu111 and Trp121 of Grb2 SH2 domain were shown as a stick model (green). Broken red lines in (b) indicated hydrogen bonds between the Hδ of Asn (pTyr+2) and Grb2 SH2 domain, as shown in the X-ray structure reported by Rahuel et al. (1996)