
Figure 8. Elevation of glutathione levels and upregulation of AP1 expression in Hfe−/− RPE cells.
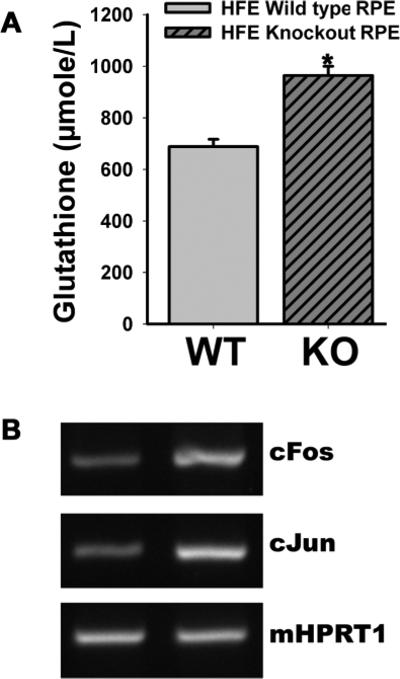
(A) Cellular content of glutathione was measured in wild type and Hfe−/− RPE cells. n = 10; *, p < 0.001. (B) RT-PCR analysis of c-Fos and c-Jun mRNA levels in wild type and Hfe−/− RPE cells. HPRT1 was used as an internal control.