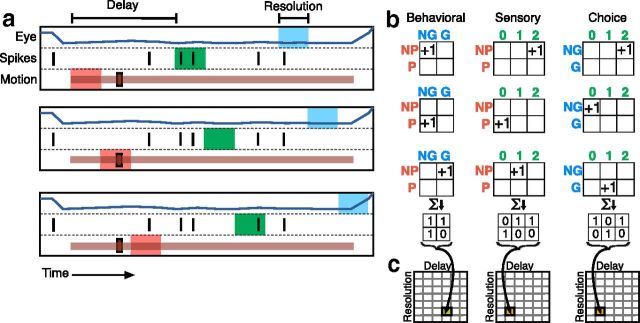
Figure 4.
Behavioral, sensory, and choice reliability were calculated for each recording session. The events of a single trial were first parceled using bins of a certain width (resolution) separated by a fixed length of time (a, delay). Three different colors represent the variables between which pairwise mutual information is computed. The stimulus was described by a binary variable according to whether a motion pulse was present (P) or absent (NP) within the red bin. Neural response was described by the number of spikes within the green bin (b, green numbers). Finally, choice was characterized according to whether the animal made a saccade (S) or did not make a saccade (NS) within the blue bin. We used the values of pairs of these variables to update contingency tables (b). The bins were moved along the length of the trial while maintaining the same delay and resolution, and contingency tables were appropriately incremented. This process was repeated for all trials from a single recording session, resulting in three contingency tables that described the relationship between values of the variables at a given delay and resolution. In this example, sensory and choice information are being calculated for the same delay (the distance between red to green bins is the same as that of blue to green bins), but the behavioral delay is twice that length of time (the distance between red to blue bins). The contingency tables were then used to calculate mutual information rates for the specified delay and resolution. c, An information surface was created by repeating the process for different delays and resolutions.

