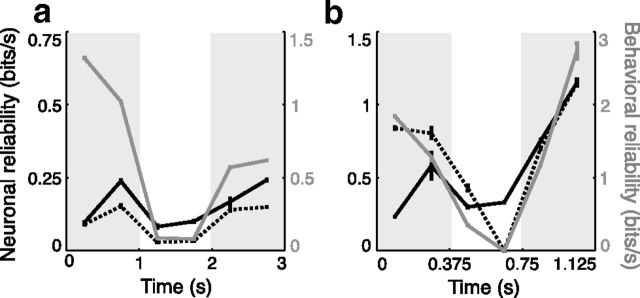
Figure 6.
Physiological and behavioral reliability as a function of time within the trials for two recording sessions. Reliability, the peak information rates observed over an information surface (Fig. 5), was computed for each epoch. a, b, For example, neurons recorded with the slow (a) and fast (b) schedules, behavioral (gray), sensory (dashed black), and choice (black) reliabilities were often strongly modulated over time in accordance with periods of high pulse probability (gray shading). Black numbers to the left of the plot indicate the scale for sensory and choice reliability, and gray numbers to the right of the plots indicate the scale for behavioral reliability.

