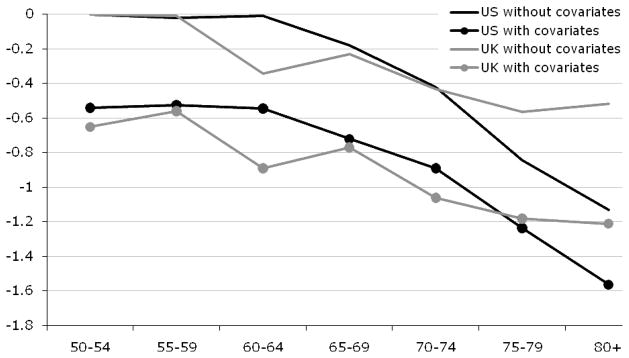
Figure 1. Normalised change in number of rooms by age, movers only.

Note: Figure 1 depicts change in number of rooms across age groups normalized to zero change in age band 50–54. These changes are provided based on a model that only includes age dummies for each age band, and a model that also includes measures of changes in family composition for spouse and children living at home and changes in employment status. These models are estimated using PSID and BHPS data (see Banks et al. (2010) for further details).
