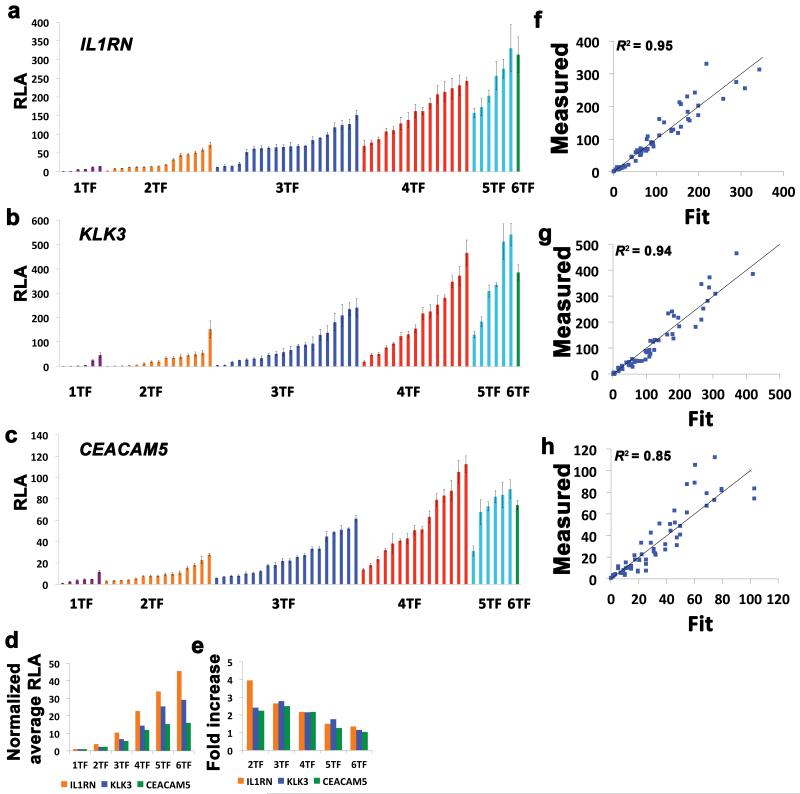
Figure 2.
Combinatorial regulation of gene expression by TALE-TFs. (a-c) All possible 63 combinations of six TALE-TFs targeting the IL1RN, KLK3, and CEACAM5 genes were tested for activation of a luciferase reporter plasmid and ordered according to number of TALE-TFs and magnitude of relative luciferase activity (RLA). Samples receiving the same number of TALE-TFs are colored identically. Mean ± SEM (n = 3) and P < 0.0001 by ANOVA for all three data sets. (d) The average RLA for the indicated number of TALE-TFs is presented for each gene. (e) The fold increase of RLA for each number of TALE-TFs relative to the average RLA for one less TALE-TF is presented for each gene. (f-h) The measured values for all 63 combinations of TALE-TFs are plotted versus the values fit by the polynomial model along with y = x. (i) Effect coefficients and corresponding P-values resulting from multiple regression of the polynomial model are provided for each TALE-TF.

