
FIG. 4.
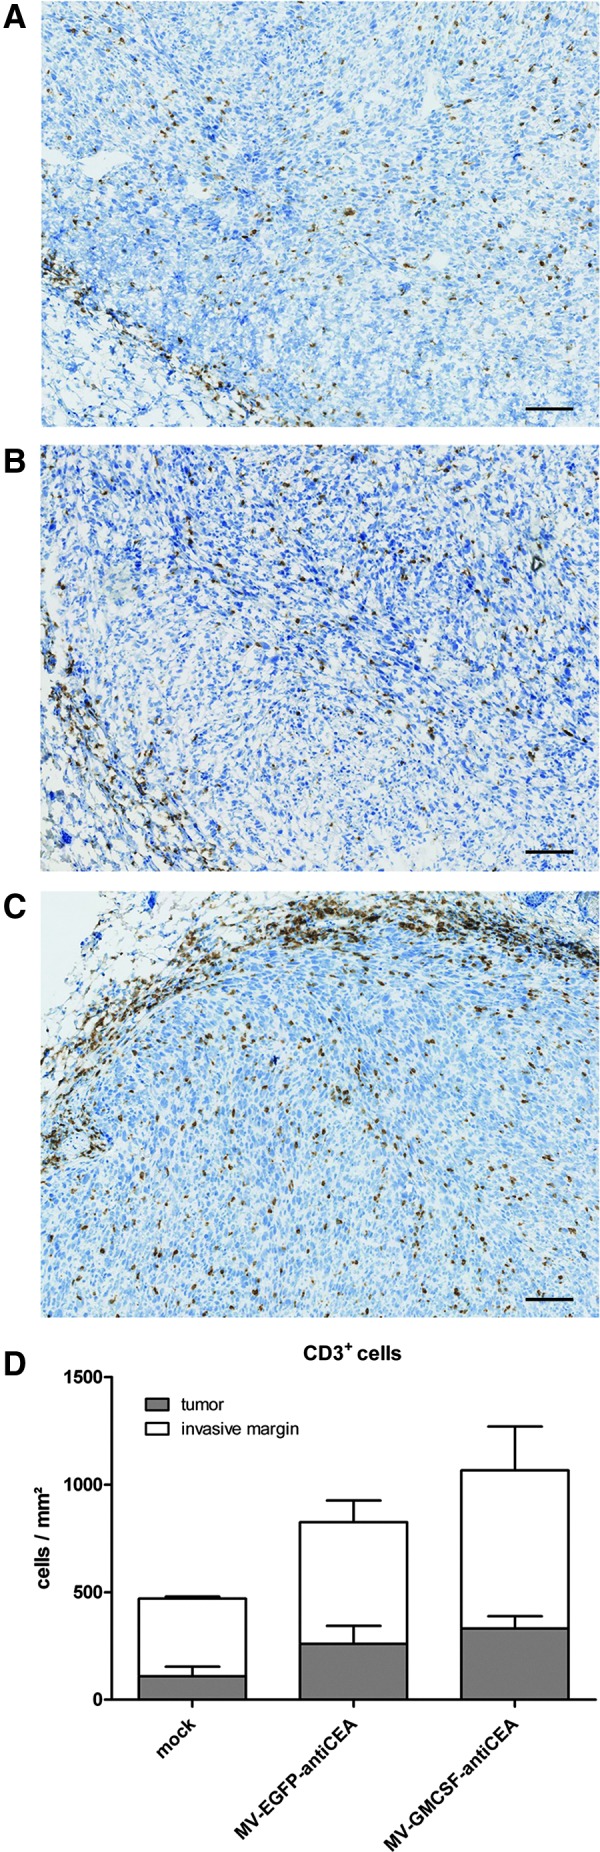
Immunohistological staining of CD3+ lymphocytes. Remaining tumors were isolated 7 days after the last virus application. The numbers of stained immune cells in tumors and at the invasive margin of (A) mock-treated, (B) MV-EGFP-antiCEA-treated, and (C) MV-GMCSF-antiCEA-treated mice were quantified automatically. Scale bars: 100 μm. (D) The average total number of CD3+ cells per tumor and invasive margin, respectively, in each group.