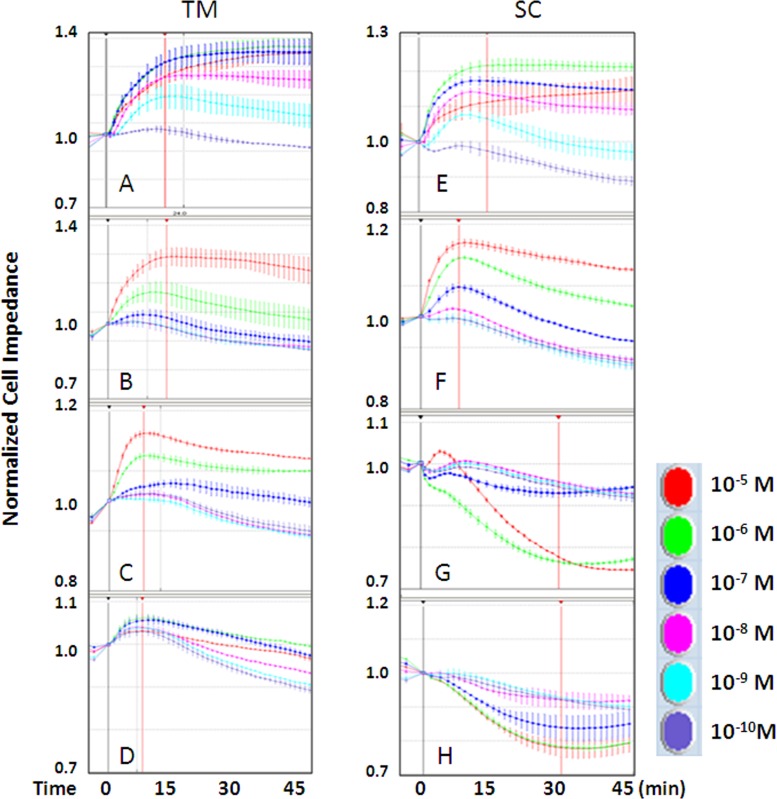
Figure 2.
Individual traces of human TM and SC cell impedance in response to PG drugs over time. Cell impedances induced by graded dose (as shown in colors) of the FP agonist 17-phenyl PGF2α (A, E), the EP1/3 agonist Sulprostone (B, F), the EP2 agonist Butaprost (C, G), and the EP4 agonist L-902688 (D, H) were normalized to 1 at time 0 of agonist addition (black vertical line). Maximum changes in cell impedance within 30 minutes of agonist addition (red vertical line) were exported for data analysis. Shown are representative traces of responses from a single cell strain for each cell type. Similar results were observed in all three strains for each cell type (n = 3).

