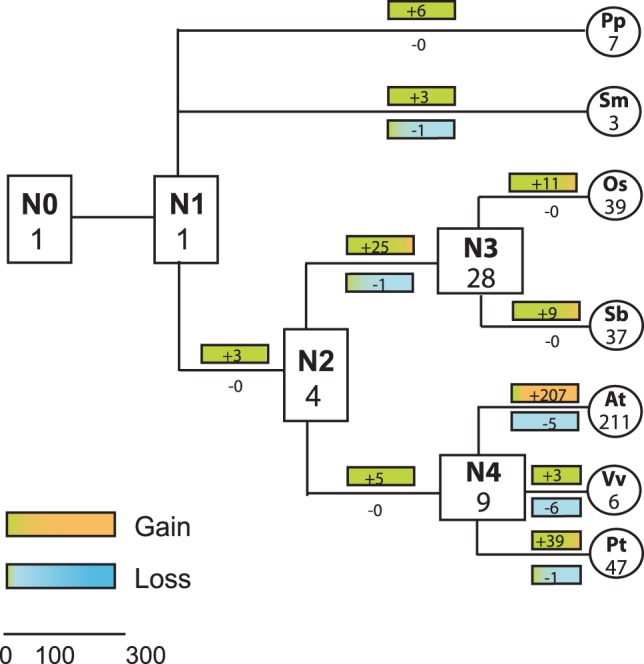
Figure 3. Evolutionary change in the number of FBA proteins in land plants.

The numbers in rectangles and circles represent the maximum number of genes in ancestral and extant species, respectively. The numbers with plus and minus signs indicate gene gains and losses, respectively, for each branch. Bold lines represent branches with high gene expansion rate. N0: Chloroplastida ancestor, N1: land plant ancestor, N2: angiosperm ancestor, N3: monocot ancestor, N4: eudicot ancestor. Branch lengths are not in proportion to evolutionary time.
