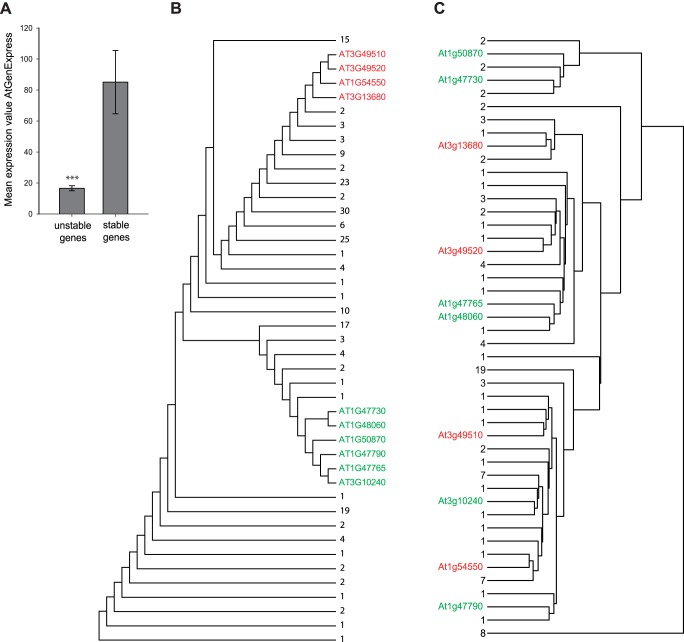
Figure 5. Differential expression profiles of phylogenetically closely related FBA genes.
A, Mean expression values for unstable and stable A. thaliana FBA genes extracted from AtGenExpress_Plus-extended_tissue_series [42]. Error bars represent SE. Statistical significance was assessed using Student´s t-test (***P<0.001). B, NJ tree of 211 A. thaliana FBA proteins based on amino acid sequence homology. C, Clustering of 102 A. thaliana FBA proteins based on co-expression data from the AtGenExpress_Plus-extended_tissue_series. Discrepancy in the number of FBA genes/proteins between the trees in A and B results from 109 missing FBA genes on the ATH1 microarray. Two clades were selected for which all genes had representatives in the ATH1-Chip for illustration purposes (highlighted in green and red font). All other genes were collapsed and labeled according to the number of FBA genes within the respective branches.

