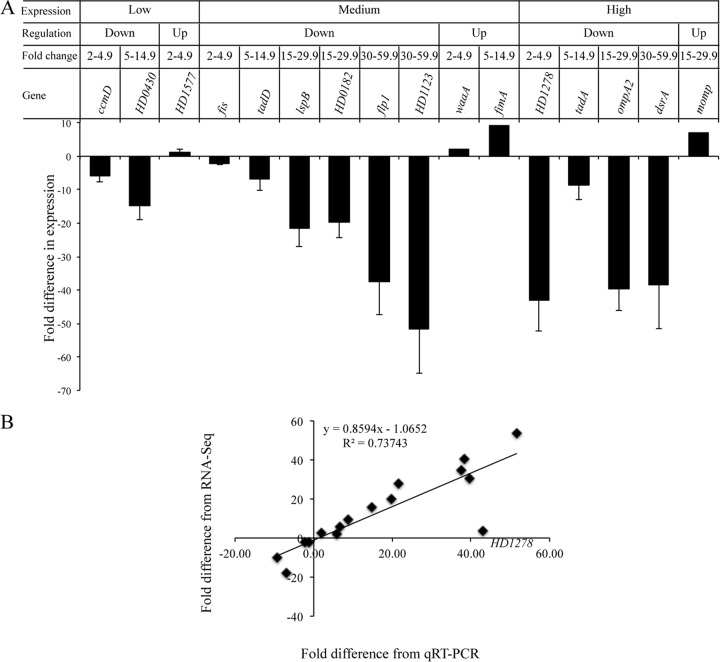
Fig 2.
qRT-PCR validation of the RNA-Seq data. (A) Fold changes in the expression of target genes in 35000HPΔcpxA relative to 35000HPΔcpxR in the stationary phase. The criteria used for selecting the targets for qRT-PCR validation are outlined at the top. The expression levels of target genes were normalized to that of dnaE. The data represent the mean ± SD from four independent experiments. (B) Correlation between the fold changes derived from qRT-PCR and RNA-Seq. The gene HD1278, for which the fold changes derived from the qRT-PCR data were not in agreement with the fold changes derived from the RNA-Seq data, is labeled on the graph.

