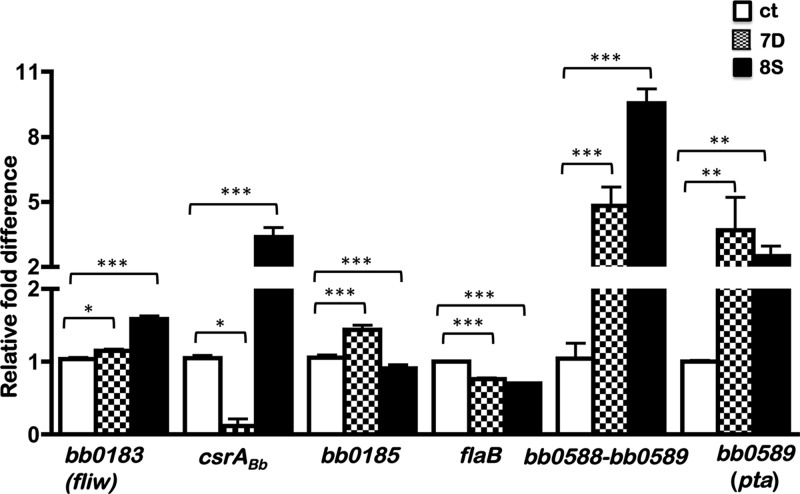
Fig 8.
Real-time reverse transcription-PCR analysis of levels of select ORFs in the ct, 7D, and 8S strains. Total RNA was isolated from borrelial strains propagated at pH 6.8/37°C as described in Materials and Methods and subjected to reverse transcription-PCR. The values for all the samples were normalized relative to the value for recA, and the change in the CT value for each transcript was obtained as an average of the values determined for each sample analyzed in triplicate. The 2−ΔΔCT values for each transcript from the ct, 7D, and 8S strains are shown as fold difference on the y axis with corresponding error bars. The ΔCT values obtained for all the ORFs analyzed from each borrelial strain were subjected to an unpaired Student's t test implemented in Prism software. The asterisks indicate levels of significance as follows: ***, P < 0.001; **, P < 0.01; *, P < 0.05.

