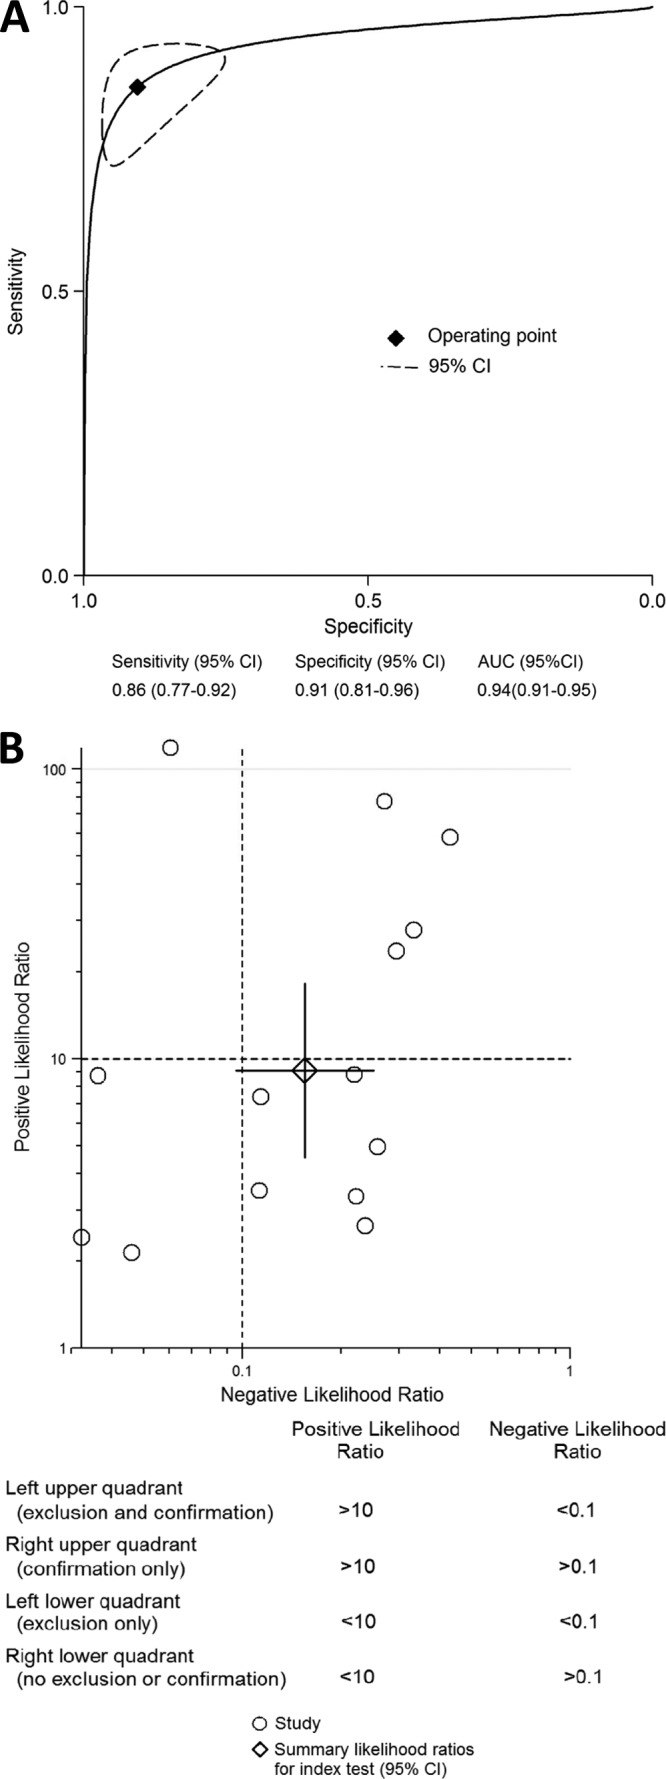
Fig 1.

Summary ROC curves (A) and likelihood ratio scattergram (B) for PCR. Curves include a summary operating point for sensitivity and specificity on the curve and a 95% confidence contour ellipsoid. The likelihood ratio profile shows that PCR is a potent tool for ruling out PJI in this patient population.
