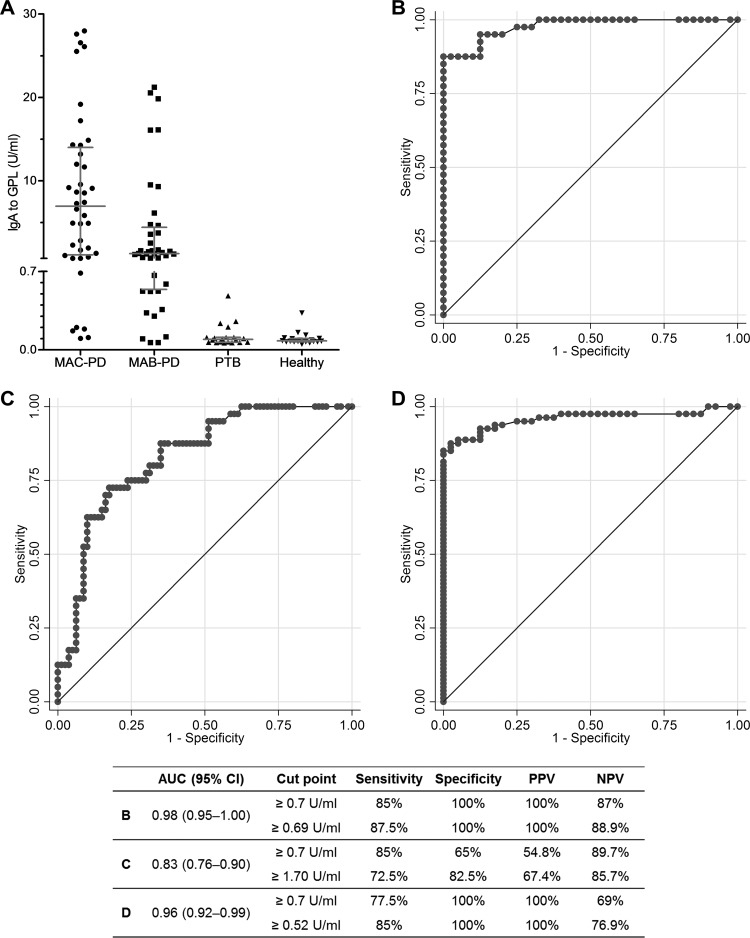
Fig 1.
Comparison of the IgA antibody response to glycopeptidolipid (GPL) core antigen and the sensitivity of the enzyme immunoassay. (A) Scattergram of IgA antibody titers plotted against GPL core antigen from 40 patients with Mycobacterium avium complex pulmonary disease (MAC-PD), 40 patients with M. abscessus complex pulmonary disease (MAB-PD), 20 patients with pulmonary tuberculosis (PTB), and 20 healthy controls. (B) Receiver operating characteristic (ROC) curve for detection of MAC-PD in the study subjects, excluding MAB-PD (area under the curve [AUC], 0.98; 95% confidence interval [CI], 0.95 to 1.00). (C) ROC curve for detection of MAC-PD among all study subjects (AUC, 0.83; 95% CI, 0.76 to 0.90). (D) ROC curve for detection of nontuberculous mycobacterial lung disease (both MAC- and MAB-PD) among all study subjects (AUC, 0.96; 95% CI, 0.92 to 0.99). PPV, positive predictive value; NPV, negative predictive value.

