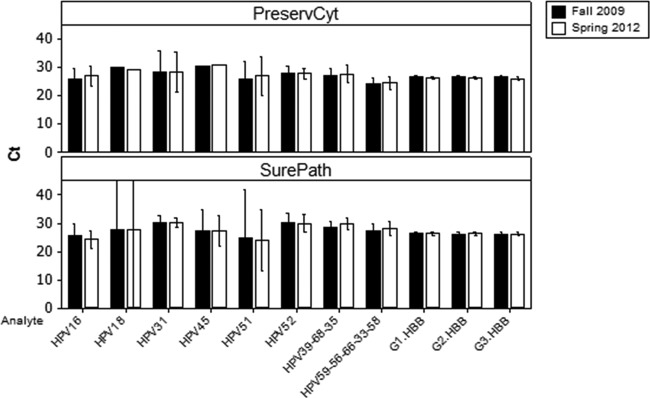
Fig 1.

Clinical positive specimen results for PreservCyt- and SurePath-stored specimens. Bar charts represent the average CT scores for the HPV types and the beta-globin (HBB) internal control in each of the three assay wells (G1, G2, G3), tested in the fall of 2009 and the spring of 2012. Results from individual patients were combined by HPV type for both SurePath and PreservCyt media. Bars represent 95% confidence intervals. The large confidence intervals observed for the SurePath HPV18 and HPV51 specimens are due to the low sample number (Table 1).
