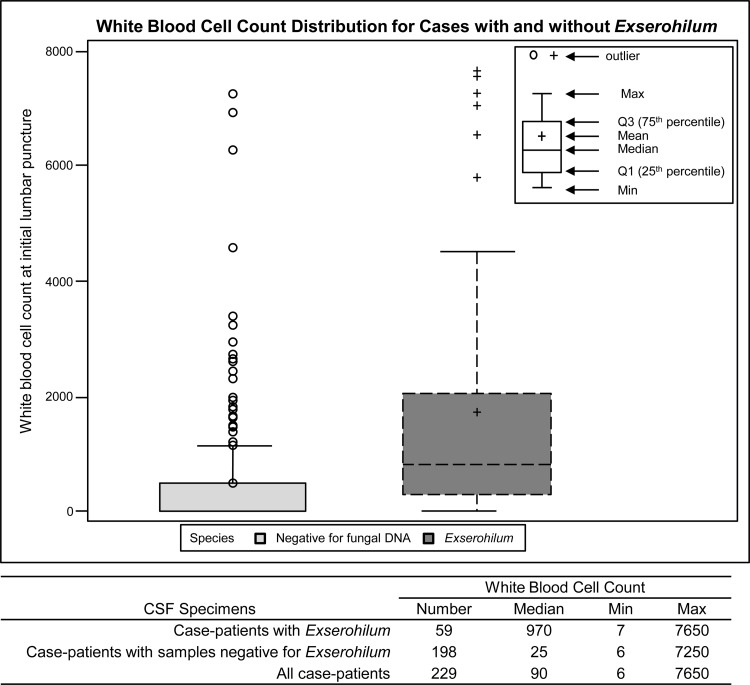
Fig 2.
Box and whisker plot representing the white blood cell count distribution in CSF specimens of meningitis case patients at initial lumbar puncture, with and without E. rostratum. The box represents the 25th and 75th percentiles of WBC, the bars represent the maximum and minimum observations, the line within the box is the median, and the circles are outliers from the expected mean.

