
Fig 2.
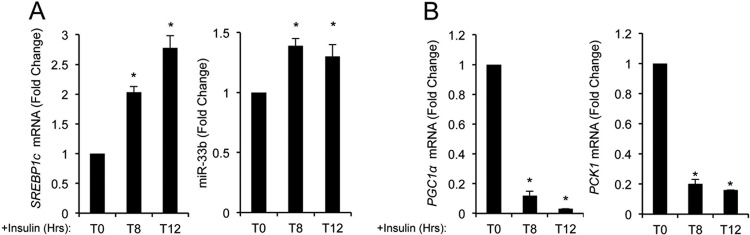
Inhibition of glucose synthesis induces SREBP1 and miR-33b expression. (A) qRT-PCR analysis of SREBP1c (left) and miR-33b (right) expression levels in HepG2 cells treated with insulin during 8 and 12 h. (B) qRT-PCR analysis of PCG1α (left) and PCK1 (right) expression levels in HepG2 cells treated with insulin during 8 and 12 h. Data are presented as means ± SEM from 3 independent experiments performed in triplicate. ∗, P ≤ 0.05 versus untreated cells (T0).