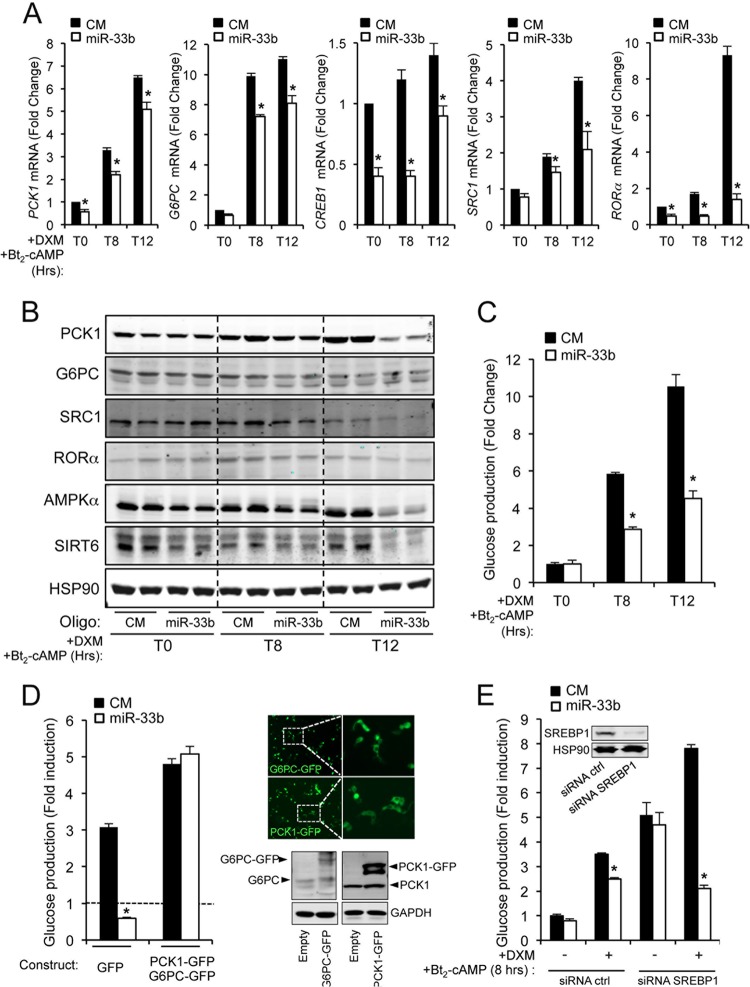
Fig 5.
miR-33 regulates glucose production in HepG2 cells. (A) qRT-PCR analysis of PCK1, G6PC, CREB1, SRC1, and RORα expression levels in HepG2 cells transfected with control miRNA (CM) or miR-33b mimic (miR-33b) and treated with DXM and Bt2-cAMP during 8 and 12 h in glucose-free medium in the presence of lactate-pyruvate (2 and 20 mM, respectively). Data are presented as means ± SEM from 3 independent experiments performed in triplicate. ∗, P ≤ 0.05 versus untreated cells at each time point. (B) Western blot analysis of PCK1, G6PC, SRC1, RORα, AMPKα, SIRT6, and HSP90 expression levels in HepG2 cells transfected with CM or miR-33b and treated with DXM and Bt2-cAMP or glucagon in glucose-free medium in the presence of lactate-pyruvate (2 and 20 mM, respectively) during 8 and 12 h. Data correspond to a representative experiment among two that gave similar results. (C) Glucose production in HepG2 cells transfected with CM or miR-33 and stimulated with DXM and Bt2-cAMP in glucose-free medium in the presence of lactate-pyruvate (2 and 20 mM, respectively) during 8 and 12 h. Data are expressed as the fold change between glucose production at different time points and that in untreated cells ± SEM and are representative of ≥3 experiments. ∗, P ≤ 0.05. (D) Glucose production in HepG2 cells transfected with green fluorescent protein (GFP) or PCK1-GFP/G6PC-GFP in the presence of CM or miR-33 and stimulated with DXM and Bt2-cAMP in glucose-free medium in the presence of lactate-pyruvate (2 and 20 mM, respectively) during 8 and 12 h. Data are expressed as the fold change between glucose production at 8 h and that in untreated cells ± SEM and are representative of ≥3 experiments. ∗, P ≤ 0.05. Right panels show the transfection efficiency by immunofluorescence (top) and Western blotting (bottom). Immunofluorescence images and Western blot images are representative of 3 independent experiments that gave similar results. (E) Glucose production in HepG2 cells transfected with nontargeting siRNA (siRNA ctrl) or SREBP1 siRNA in the presence of CM or miR-33 and stimulated with DXM and Bt2-cAMP in glucose-free medium in the presence of lactate-pyruvate (2 and 20 mM, respectively) during 8 h. Data are expressed as the fold change between glucose production after 8 h of treatment and glucose production in untreated cells ± SEM and are representative of ≥3 experiments. ∗, P ≤ 0.05. Western blot insets show the siRNA transfection efficiency.

