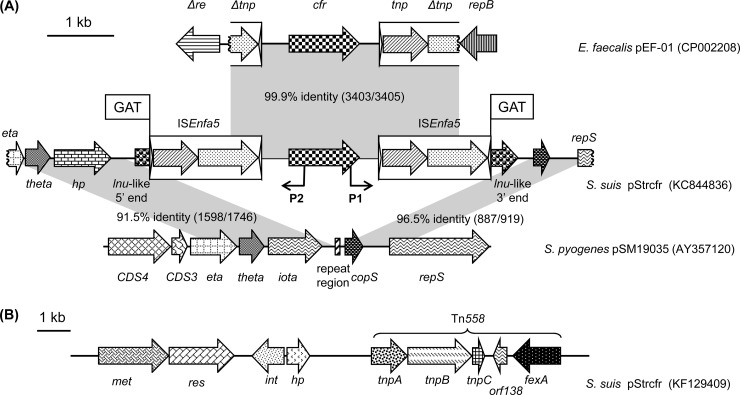
Fig 2.
(A) Genetic environment of the cfr gene in plasmid pStrcfr from strain S10 and structural comparison with plasmids pEF-01 from E. faecalis EF-01 and pSM19035 from S. pyogenes; (B) genetic environment of the fexA gene in pStrcfr. The arrows indicate the positions and directions of transcription of the genes. Different genes are indicated by different shadings. Regions of >90% homology are marked by gray shading. Black arrows labeled P1 and P2 indicate the primers used for inverse PCR.

